How much will the EU pay Russia for fossil fuels over the next 12 months?
With sanctions incomplete, the European Union could pay Russia about €30 billion for fossil fuels in the next year.
In the first year after Russia’s invasion of Ukraine on 24 February 2022, the European Union paid just under €140 billion to Russia for fossil fuels, including €83 billion for oil and €53 billion for natural gas 1 See CREA Russian Fossil Fuel Tracker, https://www.russiafossiltracker.com. . A further €3 billion was spent on coal. Payments for oil imports comprised €53 billion for crude and €30 billion for refined oil products. Gas imports were split between €41 billion for pipeline imports, and €12 billion for liquified natural gas (LNG).
It has been a priority for the EU to reduce these payments. Sanctions on seaborne crude oil took effect in December 2022, and on refined oil products in February 2023. However, while the EU-Russia energy trade has been reduced, it has certainly not stopped, with no sanctions imposed so far on Russian gas.
In this context, what energy flows from Russia can be expected over the next 12 months, and how much will the EU pay? Volume and price are both uncertain, but we estimate the EU could pay Russia between €14 billion and €69 billion in the next 12 months, depending on assumptions (see the appendix). In a baseline scenario, the amount would be €29 billion (Table 1). For comparison, in 2019, the EU paid Russia €112 billion for fossil fuels; in 2020, €68 billion; and in 2021, €123 billion 2 See Bruegel Russian Foreign Trade Tracker, available at https://www.bruegel.org/dataset/russian-foreign-trade-tracker. .
Assumptions
Table 2 sets out a baseline scenario, based on the most updated information available, for the volume of flows and anticipated prices. The appendix includes several scenarios based on more optimistic or pessimistic assumptions on quantities and prices, that provide a range for payments of €14 billion to €69 billion. It should be noted that given the extreme levels of uncertainty, probabilities cannot be assigned to these scenarios, not even to the baseline scenario 3 [1] Most policy institutions now follow this practice when making macroeconomic forecasts. At the start of the pandemic, the European Central Bank and the European Commission stopped providing probability distributions around their inflation and output forecasts. Instead, the baseline scenario – the scenario based on the most updated information – is accompanied by scenarios that represent opportune (favourable) and adverse (unfavourable) assumptions. The forecaster, therefore, refrains from taking a view on whether the baseline scenario is more probable than, say, an adverse scenario, even if the hope is that it is. The range of outcomes derived from such an analysis inform policymakers about events for which they need to prepare. . Our approach is justified since energy variables are even more difficult to forecast than macroeconomic variables. Energy prices are always analysed in the context of what-if scenarios, and energy quantities, while stable in normal circumstances, are also very susceptible to abrupt changes in the context of war.
Baseline scenario assumptions
- Pipeline gas: We assume Russia continues to export gas at similar volumes to today via both Ukraine and the Turkstream pipeline (630,000 megawatt hours daily) at current prices, €50 /MWh 4 We formulate this as Turkstream imports remaining steady at their 2022 average, while for the more volatile flows through Ukraine transit, we take the baseline assumption of 2023 average. Data from the Bruegel natural gas imports dataset: https://www.bruegel.org/dataset/european-natural-gas-imports. Natural gas prices are month-ahead TTF prices reported by the Intercontinental Exchange. .
- LNG gas: We assume LNG imports from Russia remain at their 2022 average (510,000 MWh daily) at current prices, €50/MWh 5 See Bruegel European natural gas imports dataset, available at https://www.bruegel.org/publications/datasets/european-natural-gas-impo…. .
- Crude oil by sea: We assume that 100,000 barrels are imported per day at current prices, €55/barrel 6 Bulgaria has an exemption allowing continuation of imports of Russian crude oil by sea. Therefore our estimate is based on Bulgaria’s national oil consumption (see the appendix), which we take from BP (2022). .
- Crude oil by pipeline: We assume that the northern branch of the pipeline does not deliver Russian oil to the EU, while flows along the southern branch of the pipeline remain at the 2022 average, 285,000 barrels per day at current prices: €55/barrel 7 Data on Druzhba pipeline flows are taken from the Bruegel Russian Crude Oil Tracker: https://www.bruegel.org/dataset/russian-crude-oil-tracker. .
Conclusions
The EU has reduced its energy imports from Russia since February 2022. However, it has not eliminated its dependence totally, particularly on gas. In the next 12 months, the EU could still pay €21 billion to Russia for gas, rising to as much as €55 billion. In a high-payment scenario, the EU may end up sending €68 billion to Russia, roughly equivalent to the total volume of military aid provided by the Ukraine-supporting alliance in one year 8 See https://www.ifw-kiel.de/topics/war-against-ukraine/ukraine-support-trac…. .
The biggest unused lever to reduce these payments is sanctions on Russian pipeline gas and Russian LNG. Exemptions from sanctions for Russian oil imports are less significant, although it is likely that indirect imports of Russian oil exist 9 Gabriel Gavin, ‘Russian oil finds “wide open” back door to Europe, critics say’, Politico, 21 March 2023, https://www.politico.eu/article/russia-oil-vladimir-putin-ukraine-war-w…. . EU energy sanctions on Russia remain incomplete and there is still space to reinforce them.
Appendix
Beyond the baseline, alternative scenarios reflect different assumptions about quantities and prices (Table A1).
Table A1: Energy payments to Russia, a scenario analysis
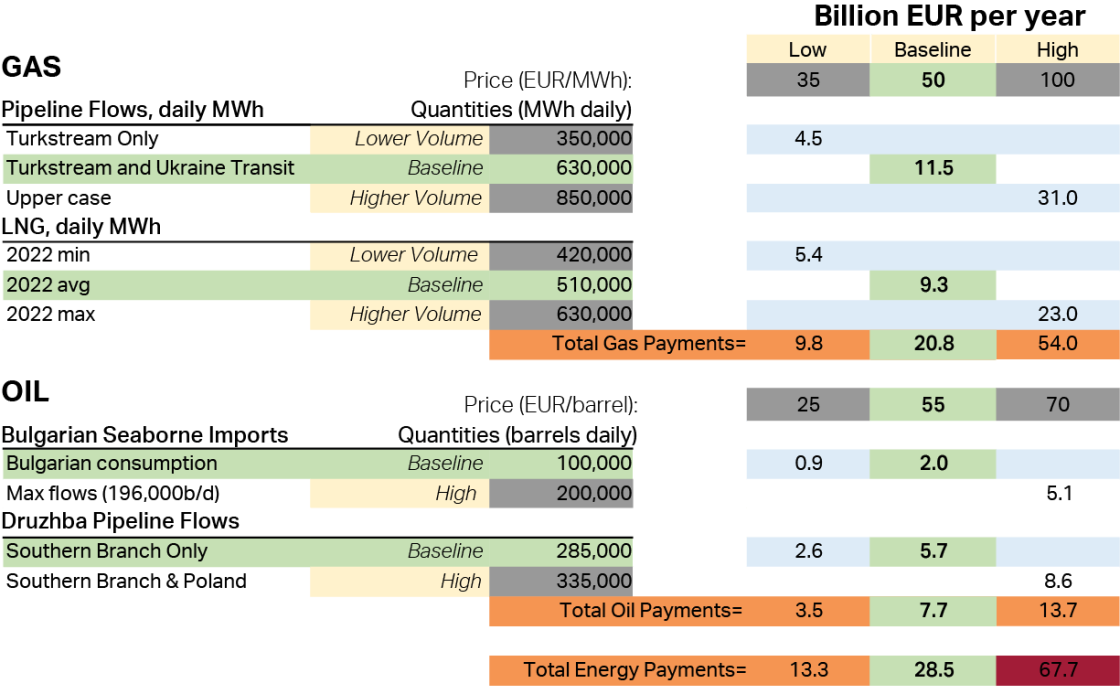
Source: Bruegel. Note: We use daily numbers and multiply by 365 to estimate what payments for energy will be for the next 12 months.
Description of baseline and alternative scenarios
Coal volumes
Coal made up only a small share of the EU’s fossil-fuel payments to Russia. The EU agreed to ban imports of Russian coal on 8 April 2022 10 See European Commission press release: https://ec.europa.eu/commission/presscorner/detail/en/ip_22_2332. . Therefore no coal imports are expected over the coming 12 months.
Natural gas volumes
The EU has not implemented any sanctions on Russian natural gas. Instead, Russia progressively cut gas exports to the EU forcing the bloc to adopt a twin strategy of reducing domestic demand and dramatically increasing LNG imports from elsewhere, while building new LNG import infrastructure. These two factors mean the EU is well on the way to becoming largely independent of Russian gas (McWilliams et al, 2023).
Prior to the invasion of Ukraine, the EU imported Russian gas through five pipeline, alongside LNG. Russian exports to the EU via the Yamal pipeline network through Poland and the Nord Stream 1 pipeline were discontinued in May and September 2022, respectively, and are not expected to resume. Similarly, small volumes of exports to the Baltic states and Finland have been discontinued.
Meanwhile, Russia continues to export pipeline gas to the continent via Ukraine (Ukraine Transit). While it has been a longstanding policy aim for Russia to divert gas flows away from this route, flows have continued, albeit at low volumes, since May 2022. A second remaining route, the Turkstream pipeline, transits Bulgaria and mainly services Hungary and Serbia. Given that Hungary signed an agreement with Gazprom for additional volumes in August 2022 11 Wilhelmine Preussen, ‘Hungary signs new gas deal with Gazprom’, Politico, 31 August 2022, https://www.politico.eu/article/hungary-signs-deal-with-gazprom-over-ad…. , these flows are the most politically secure.
In a baseline scenario, we assume Russia continues to export gas at similar volumes to today via both Ukraine and the Turkstream pipeline (630,000 MWh daily). In a lower volume scenario, Ukraine transit flows are cut, but Turkstream flows continue (350,000 MWh daily). In a higher volume scenario, Ukraine transit flows increase marginally back to their 2022 average, with Turkstream flows continue (850,000 MWh daily) 12 Turkstream flows averaged 350,000 MWh/day in 2022, and Ukraine transit, 500,000 MWh/day. In 2023, Ukraine transit flows have averaged 280,000 MWh/day. . The lack of any EU sanctions on Russian gas means that flows through Ukraine could even exceed their 2022 average in a more extreme scenario.
LNG volumes
Russia also exports LNG to European ports. These flows were consistent throughout 2022 with no strong signals from either the Russian or European side to suggest their termination. LNG exports to the EU are unlike pipeline exports for Russia in that they do not offer strong market power. Were Russia to terminate flows and re-direct exports, theoretically the EU should find substitute supply on global markets, similarly to how Russia has been able to redirect crude oil supplies. A baseline scenario assumes LNG imports at their 2022 average (510,000 MWh daily), a higher volume scenario assumes the maximum monthly imports from 2022 are continued for the next year (630,000 MWh daily), and a lower volume scenario assumes the same for the minimum monthly imports from 2022 (420,000 MWh). The introduction of EU sanctions on Russian LNG would cut these volumes.
Oil volumes
The EU has banned the import of crude oil and refined oil products from Russia. The sanctions apply only to transport by sea, thus exempting crude oil pipeline imports from Russia via the Druzhba pipeline.
An exemption has also been granted to Bulgaria to import crude oil by sea, with these imports serving a Lukoil (Russian) owned refinery. The refinery has a throughput capacity of 196,000 barrels/day and in recent months Russian imports were close to this 13 On refinery capacity, see Reuters, 'Bulgaria clears way to take control of Lukoil oil refinery if needed', 13 January 2023, https://www.reuters.com/business/energy/bulgaria-clears-way-take-contro…. . However, the sanctions now prohibit Bulgaria from exporting oil products from the refinery. Given that Bulgarian consumption is closer to 100,000 barrels per day, we expect imports to decrease (BP, 2022). In the baseline scenario, seaborne imports are assumed to be 100,000 barrels/day, while in a higher volume scenario they are 200,000. This would imply Bulgaria’s refinery running consistently above domestic consumption levels.
Germany has committed to ending pipeline oil imports, and Russia has cut exports to Poland 14 Reuters, ‘Russia halts pipeline oil to Poland says refiner PKN Orlen’, 25 February 2023, https://www.reuters.com/markets/commodities/russia-halts-pipeline-oil-s…. . At the end of January 2023, Poland’s PKN Orlen said that a supply deal with Rosneft had ended, leaving a contract with Tatneft for 200,000 tonnes per month 15 Reuters, 'Poland's PKN Orlen applied for 3 mln T of Russian oil via Druzhba for 2023 - Kommersant newspaper', 16 November 2023, https://www.reuters.com/article/russia-oil-exports-poland-idUSL1N32C1WH. . These supplies were terminated as of end-February 2023. Flows continue along the southern branch of the pipeline to Czechia, Hungary and Slovakia. Our baseline scenario assumes that flows along the southern branch of the pipeline remain at their 2022 average, 285,000 barrels/day. A higher volume scenario assumes that Poland continues to import from Tatneft, bringing the total to 335,000 barrels/day.
Last, all meaningful oil product imports to the EU from Russia came by sea and have been discontinued. All scenarios assume no refined oil products are imported from Russia. We note, but do not include in our calculations, that the EU will continue to import refined oil products from countries that import Russian crude oil, potentially leading to indirect payments.
Gas prices
The exact contractual terms under which Russia sells gas to European companies are not public. Contracts are indexed to one month or a few months ahead TTF prices. TTF refers to the price of gas traded virtually in the Netherlands, and is widely considered the benchmark for north-west and wider European gas prices. TTF futures for one-month and one-year ahead trade at time of writing around €50/MWh. This constitutes our baseline assumption. The typical price prior to COVID-19 and Russia’s invasion of Ukraine was €15/MWh. For a low price scenario, we assume €35/MWh.
We assume a price of €100/MWh in an high price scenario. For the winter of 2022/23, TTF prices hovered around €130/MWh for the first half and averaged closer to €60/MWh for the second half as the risk of drawing storages too low evaporated. The winter of 2022/23 already saw Russian imports at our baseline assumption, and storages were above 90 percent full before winter, which is the target again for winter 2023/24.
Prices of gas and the flow of Russian volumes are not independent variables. High prices have largely been driven by Russian volumes being low over the past two years. There is therefore an inherent stabilisation mechanism, reducing the likelihood of our extreme scenarios. If Russia sends higher volumes, benchmark gas prices are likely to decrease.
Oil prices
For crude oil, the EU and G7 price cap prohibits the transport of Russian crude oil above a price of $60/barrel. Bulgaria, therefore, should pay a maximum price of $60, equivalent to €55 per barrel, which we assume for the baseline scenario. Babina et al (2023) have however shown the possibility of the price cap being circumvented with upside to around $74/barrel, and hence a high price scenario of prices at €70 per barrel is assumed. This would imply a constant violation of the price cap. The production cost of Russian oil is around €25/barrel. Hence, in a low price scenario of the opposite direction we assume a €25/barrel price. This would imply Russia continuing to export even at very low profit.
Druzhba pipeline imports are governed by long-term contracts, but terms should closely follow developments for the loaded price of seaborne Russian Urals. This assumption is in line with an analysis of Eurostat trade data available up to the end of 2022 16 Eurostat Dataset Code DS-058213, Extra-EU trade since 2000 by mode of transport, by HS2-4-6. . We make the same assumption of an high price (€70/barrel), low price (€25/b) and baseline price (€55/b).
References
Babina, T., B. Hilgenstock, O. Itskhoki, M. Mironov and E. Ribakova (2023) ‘Assessing the Impact of International Sanctions on Russian Oil Exports’, mimeo, available at http://dx.doi.org/10.2139/ssrn.4366337
BP (2022) Statistical Review of World Energy, available at https://www.bp.com/en/global/corporate/energy-economics/statistical-review-of-world-energy.html
McWilliams, B., S. Tagliapietra, G. Zachmann and T. Deschuyteneer (2023) ‘Preparing for the next winter: Europe’s gas outlook for 2023’, Policy Contribution 01/2023, Bruegel
[1] See CREA Russian Fossil Fuel Tracker, https://www.russiafossiltracker.com.
[2] See Bruegel Russian Foreign Trade Tracker, available at https://www.bruegel.org/dataset/russian-foreign-trade-tracker.
[3] Most policy institutions now follow this practice when making macroeconomic forecasts. At the start of the pandemic, the European Central Bank and the European Commission stopped providing probability distributions around their inflation and output forecasts. Instead, the baseline scenario – the scenario based on the most updated information – is accompanied by scenarios that represent opportune (favourable) and adverse (unfavourable) assumptions. The forecaster, therefore, refrains from taking a view on whether the baseline scenario is more probable than, say, an adverse scenario, even if the hope is that it is. The range of outcomes derived from such an analysis inform policymakers about events for which they need to prepare.
[4] We formulate this as Turkstream imports remaining steady at their 2022 average, while for the more volatile flows through Ukraine transit, we take the baseline assumption of 2023 average. Data from the Bruegel natural gas imports dataset: https://www.bruegel.org/dataset/european-natural-gas-imports. Natural gas prices are month-ahead TTF prices reported by the Intercontinental Exchange.
[5] See Bruegel European natural gas imports dataset, available at https://www.bruegel.org/publications/datasets/european-natural-gas-imports/.
[6] Bulgaria has an exemption allowing continuation of imports of Russian crude oil by sea. Therefore our estimate is based on Bulgaria’s national oil consumption (see the appendix), which we take from BP (2022).
[7] Data on Druzhba pipeline flows are taken from the Bruegel Russian Crude Oil Tracker: https://www.bruegel.org/dataset/russian-crude-oil-tracker.
[8] See https://www.ifw-kiel.de/topics/war-against-ukraine/ukraine-support-tracker/.
[9] Gabriel Gavin, ‘Russian oil finds “wide open” back door to Europe, critics say’, Politico, 21 March 2023, https://www.politico.eu/article/russia-oil-vladimir-putin-ukraine-war-wide-open-back-door-to-europe-critics-say/.
[10] See European Commission press release: https://ec.europa.eu/commission/presscorner/detail/en/ip_22_2332.
[11] Wilhelmine Preussen, ‘Hungary signs new gas deal with Gazprom’, Politico, 31 August 2022, https://www.politico.eu/article/hungary-signs-deal-with-gazprom-over-additional-gas/.
[12] Turkstream flows averaged 350,000 MWh/day in 2022, and Ukraine transit, 500,000 MWh/day. In 2023, Ukraine transit flows have averaged 280,000 MWh/day.
[13] On refinery capacity, see Reuters, 'Bulgaria clears way to take control of Lukoil oil refinery if needed', 13 January 2023, https://www.reuters.com/business/energy/bulgaria-clears-way-take-control-lukoil-oil-refinery-if-needed-2023-01-13/.
[14] Reuters, ‘Russia halts pipeline oil to Poland says refiner PKN Orlen’, 25 February 2023, https://www.reuters.com/markets/commodities/russia-halts-pipeline-oil-supplies-poland-pkn-orlen-ceo-says-2023-02-25/.
[15] Reuters, 'Poland's PKN Orlen applied for 3 mln T of Russian oil via Druzhba for 2023 - Kommersant newspaper', 16 November 2023, https://www.reuters.com/article/russia-oil-exports-poland-idUSL1N32C1WH.
[16] Eurostat Dataset Code DS-058213, Extra-EU trade since 2000 by mode of transport, by HS2-4-6.
