Europe’s under-the-radar industrial policy: intervention in electricity pricing
Government efforts to artificially lower electricity prices for one group of consumers will raise prices for others, with cross-border implications.
Executive summary
The different ways in which European Union member-state governments add levies to the price of electricity creates huge discrepancies in the prices paid by consumers. Europe’s energy transition depends upon increasing electrification of the economy and increasing the share of that electricity produced by renewable sources. Both factors raise the importance of electricity taxes set by governments.
The energy crisis drew attention to this: as electricity prices soared, governments responded with billions of euros in subsidies to protect households and companies. While the acute phase of the energy crisis has passed, growing concerns about industrial competitiveness create political pressure for governments to continue with such subsidies or tax exemptions. High profile examples include the French reform of nuclear-power generated electricity pricing, and a political debate in Germany over how aggressively to subsidise the electricity price paid by energy-intensive firms.
We frame the debate on intervention in electricity pricing around five distributional dilemmas concerning the recuperation of electricity expenses: 1) whether to raise general or electricity taxes, 2) the split between household and companies, 3) the split between energy-intensive and non-energy intensive companies, 4) cross-border effects, and 5) trade-offs in attracting new clean-technology manufacturing factories.
Priorities according to these distributional criteria will differ by country, but these factors should be central to discussions. Governments must recognise that efforts to lower prices artificially for one group of consumers will raise prices for others, including with cross-border implications. The current compromises in the French and German cases do not pose substantial issues to the integrity of the European single market and do not penalise non-energy-intensive domestic consumers excessively.
The authors are grateful for comments from Conall Heussaff, Stephen Gardner, Philipp Jäger, Phuc Vinh and Jeromin Zettelmeyer.
Given the importance of the distributional questions raised in this policy brief, we have compiled a comprehensive and interactive dashboard visualising final electricity prices in EU member countries. The dashboard is divided into three sections: 1) Electricity tariffs components in EU27 countries across different consumer types, 2) Cross-country comparison and 3) Electricity tariffs components evolution by country.
1 Introduction
The European Union successfully navigated the 2022 energy crisis and it is now more energy secure and more resilient against energy shocks (McWilliams et al, 2023). However, gas and electricity prices in the EU have remained persistently above their pre-crisis levels. The prospect of a persistent energy-price disadvantage compared to major competitors might be more challenging for the EU’s industrial competitiveness than the energy crisis itself
1
French and German ministers, for example, have called for measures to tackle Europe’s disadvantage on energy. See Jonathan Packroff, ‘Germany’s Habeck calls for ‘Zeitenwende’ on industrial subsidies’, Euractiv, 24 October 2023 https://www.euractiv.com/section/economy-jobs/news/germanys-habeck-call…, and Euronews with AFP, ‘Europe needs
. European policymakers are now confronted with the double challenge of decarbonising their countries’ economies, implying increased electricity consumption, while maintaining industrial competitiveness. This challenge brings electricity policy to the forefront of industrial policy.
Varying taxes and tariffs mean different consumers in the same market pay vastly different electricity prices. In the coming decade, European energy consumption will shift increasingly to electricity and decisions made by government over these levies will become ever more significant, with economic, political and societal consequences.
In this Policy Brief we discuss the main trade-offs facing governments in this respect. We outline the impacts of the energy crisis, during which high and volatile electricity prices stimulated billions of euros in government subsidies. We then discuss the growing electrification of European economies and the growing role for government in distributing the costs of this transition across society. We discuss the specific cases of electricity pricing debates in France and Germany. We conclude by outlining the five essential distributional trade-offs governments must confront when setting electricity taxes:
- Recovering costs through electricity tariffs or general taxation
- The split of taxes between households and industry
- The split of taxes between energy-intensive and the remaining industry
- Cross-border impacts of subsidies
- Trade-offs to consider when attracting clean technology manufacturing.
2 The lasting impact of the crisis
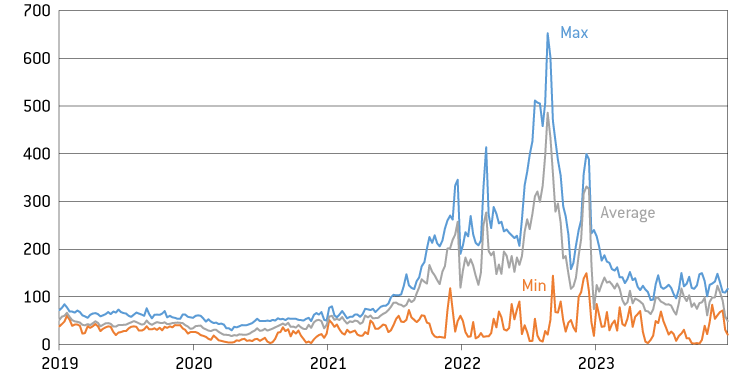
The effect of the energy crisis on electricity prices has been dramatic, with wholesale prices peaking in August 2022 above ten times the 2019-2020 average price and differences between EU countries widening. The electricity mixes in different countries are fundamental in setting the price of electricity. Government support schemes for certain technologies to a great extent define each country’s electricity mix.
Figure 1 shows the weekly average minimum and maximum electricity prices in the EU, excluding islands. In the past three years, Sweden and Italy have consistently set the minimum and maximum prices in the EU. This reflects past policy choices, with Sweden betting on nuclear and renewables, while Italy relies to a much greater extent on natural gas.
Figure 1: European wholesale electricity prices, min-max range and Swedish and Italian prices, €/MWh
Source: Bruegel based on Energy Charts.
Figure 1 also shows that while wholesale electricity prices decreased in the second half of 2023, the price differential remains larger than before the energy crisis, with a higher upper limit. In the first half of 2023, EU wholesale prices fluctuated on average around €100/MWh, compared to a range of $30-$50/MWh across key United States markets, approximately $75/MWh in Japan and $60/MWh in India.
Intervention in electricity prices is part of the industrial policy toolkit of governments. France has the Regulated Access to Historic Nuclear Energy (ARENH) system (see section 5), designed to “give French customers the comparative advantage of the low production costs of the historical nuclear plant pool” (Cours des Comptes, 2022). In Germany, certain industrial consumers benefit from a dozen exemptions, including exemption from the renewables surcharge (EEG, from Erneuerbare-Energien-Gesetz – Renewable Energy Sources Act) to keep their electricity prices lower
2
See BAFA press release of 21 December 2017, ‘Special compensation regulation contributes to the stabilization of the EEG levy’, https://www.bafa.de/SharedDocs/Pressemitteilungen/DE/Energie/2017_23_be…
.
However, since the COVID-19 pandemic, government intervention in the economy has dramatically increased. After Russia’s invasion of Ukraine, support was channelled towards mitigating the energy-price shock. Total energy subsidies in the EU rose from €177 billion in 2015 to €216 billion in 2021 and spiked at an estimated €390 billion in 2022 (European Commission, 2023a). Natural gas and electricity subsidies increased the most in 2023, tripling from €15 billion and €20 billion to €46 billion and €64 billion, respectively.
Exceptional energy support measures allowed under the EU’s March 2022 Temporary Crisis and Transition Framework for State Aid (sections 2.4 and 2.7)
3
C/2023/1188, available at https://eur-lex.europa.eu/eli/C/2023/1188/oj.
were due to expire at the end of 2023, before EU governments successfully lobbied for a six-month extension until June 2024
4
See European Commission press release of 20 November 2023, ‘Commission adjusts phase-out of certain crisis tools of the State aid Temporary Crisis and Transition Framework’, https://ec.europa.eu/commission/presscorner/detail/en/ip_23_5861.
. Subsidies to support business affected by the energy shock have been generally approved under the EU state aid crisis frameworks, approval granted to more than €672 billion in aid since March 2022
5
Approved support refers to budgeted allocation and does not necessarily correspond to final disbursement.
. Much of the approved support extends beyond 2023. The largest shares were for Germany (53 percent of the total, or €356 billion), and France (24 percent, equivalent to €161 billion).
Temporary loosening of EU state aid rules has made such largess possible, but in 2024 the EU fiscal rules – the Stability and Growth Pact, which governs how much debt governments can build up – will be replaced by a new framework (see Darvas et al, 2023), requiring fiscal adjustment for all countries with debt above 60 percent of GDP and/or deficits above 3 percent (this includes Germany). With energy prices remaining stubbornly above their pre-crisis levels, and an international trend of more active industrial policy (for example, the Inflation Reduction Act in the US), Germany and France wish to extend substantial subsidies for domestic industry
6
See, for example, Varg Folkman, Giorgio Leali and Aoife White, ‘France and Germany risk EU rift over energy subsidies’, Politico, 26 October 2023, https://www.politico.eu/article/france-joins-germany-in-pushing-for-ene….
.
German government interventions to reduce electricity levies and fees for energy-intensive companies were the largest among the five major EU countries (Table 1). Retail prices for energy-intensive companies in Spain have increased less than in any other major EU country, driven by government intervention in the pricing mechanism and increasing shares of renewables. The energy-supply component of retail prices paid by energy-intensive industry increased most dramatically in Italy, where natural gas sets the price of electricity in 90 percent of hours – more than in any other EU country (Gasparella et al, 2023). Poland is the only country where the tax component of electricity prices for energy-intensive companies went up over the period.
Table 1: Retail price changes for energy-intensive industry from 2021 to 2023 (eurocents/kWh)
Source: Bruegel based on Eurostat. Note: prices are an unweighted average of the three highest consumption bands reported by Eurostat (above 20 GWh/year). We take prices from the first half of each year.
3 Electrified Europe
Electricity is the future of the European energy system. Consumers are already swapping gas boilers for heat pumps and petrol cars for electric vehicles. Consequently, the share of final energy demand met by electricity is set to grow. In 2021, electricity provided 23 percent of the EU’s final energy demand
7
See https://ec.europa.eu/eurostat/statistics-explained/index.php?title=Ener….
. This share is projected to grow to 30 percent in 2030, and 50 percent in 2050, in scenarios that see the EU achieve its emission reduction targets (European Commission, 2020b).
Rapid installation of solar panels and wind turbines means renewable energy sources will meet an increasing share of this electricity generation. In 2019, wind was 13 percent of EU electricity generation, increasing to 15 percent by 2022. Over the same period, solar has increased from 4 percent to 7 percent
8
See Ember electricity data explorer, https://ember-climate.org/data/data-tools/data-explorer/.
. EU leaders have set a target for renewables to meet 42.5 percent of final energy demand by 2030. This implies that renewables will meet 65 percent to 70 percent of electricity demand (also including generation from hydro and biofuels) (European Commission, 2022).
A major consequence is that the number of hours in which renewables can meet total electricity demand will increase. Consequently, renewables will be responsible for setting market prices more frequently (prices in European electricity markets are set by the source which provides the last unit of supply required to meet demand
9
For example, if renewables provide 90 percent of supply but the missing 10 percent is provided by natural gas, the price will be set equal to the price of gas.
). For a better sense for the magnitude of this change, we performed an intuitive exercise. We extrapolated from the national hourly output from wind, solar and hydro in selected countries in 2022 using projected capacities for 2030, and compared this with projected hourly demand. We then summed the renewable output for every hour of the year and compare this to demand. This exercise showed that renewables could meet total demand in Spain for 25 percent of hours in 2030, and in Germany for 30 percent of hours, compared to 0 percent of hours in 2022
10
The exercise was done using ENTSO-E data (ENTSO-E, 2022), and was based on announced government plans available to ENTSO-E for their 2022 analysis. The Spanish government has since increased targets.
.
These numbers are intended only as an illustration of the scale of the changes coming. The number of hours for which renewables will be at the margin cannot be projected because of too many areas of uncertainty. Gasparella et al (2023), for example, came to a different conclusion, finding that electricity price setting will still be dominated by fossil fuels in 2030.
While the pace of change can be debated, renewable generation will ultimately dominate. This phenomenon will transform the operation of electricity markets, reducing the share of fuel costs in final electricity bills. To a certain degree, this reduction will be offset by an increase in fees and tariffs. These include network tariffs (payments for maintaining and expanding the electricity grid), capacity mechanism payments (to power sources, such as gas power plants, that must be paid to remain on standby) and renewable levies (to pay the capital costs of renewable plants).
4 The growing role for government: allocating costs
Final electricity prices paid by households and companies (hereafter referred to as retail prices) are already influenced strongly by regulatory choices. Only one-third of the average retail electricity price paid by EU households in 2021 related to the cost of energy, while the other two-thirds was taxes (Figure 2). Taxes weigh more on the final price paid by consumers when the volumes of electricity contracted are smaller. In the coming years, taxes, levies and other regulated components will make up an even greater share of prices, and governments will continue to decide how these costs are split between consumer groups. Instruments for influencing final prices include tax exemptions, reduced levies and compensatory mechanisms. For example, energy-intensive industries pay far lower network costs compared to households and less energy-intensive companies (Figure 2).
Figure 2: Retail electricity prices by component and user type, €/KWh, EU (2021)
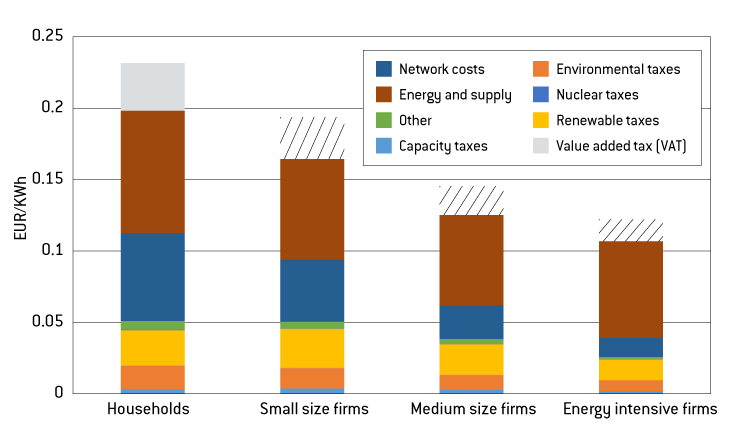
Source: Bruegel based on Eurostat. Note: Firms are generally eligible for VAT refunds, and that is the case also for some renewable taxes, such as the EEG surcharge in Germany. Small firms are the Eurostat consumption band between 20 and 499 MWh, medium firms are between 2 and 19.9 GWh, and energy-intensive firms between 70 and 149.9 GWh. Households refers to the TOT_KWh Eurostat consumption band.
The numbers involved are very significant. In Germany, industrial consumers benefit from a broad range of overlapping rules and exceptions (German Ministry of Finance, 2023). In 2023, reductions in electricity taxes for industry were estimated to be €1.7 billion. Reduced levies for offshore wind and combined heat and power plants amounted to an additional almost €1 billion. A further €3 billion was used to offset the increase in electricity prices paid by industrial consumers because of the EU emissions trading system
11
The introduction of the emissions trading system, which puts a carbon price on fuels used to generate electricity, raised average wholesale prices. European governments are permitted under state aid to provide ‘indirect cost compensation’ to compensate for this.
. The existence of a single price zone across Germany also benefits electricity-intensive companies in southern and western regions, which enjoy lower wholesale prices at the expense of higher network costs that they do not pay fully.
A report on energy costs, taxes and the impact of government interventions (European Commission, 2020) found that energy-intensive industries and agriculture typically pay the lowest taxes relative to the amount of energy consumed, while road transport sectors pay the most. The study highlights that energy-intensive industry accounts for 18 percent of energy consumption in the EU but only 2 percent of energy-tax revenues, while agriculture accounts for 3 percent of energy use and 0.5 percent of energy-tax revenue. Transport accounts for 29 percent of energy consumption and 60 percent of energy-tax revenue
12
Fuel taxes also address strong externalities, including paying for public road infrastructure.
. For instance, energy-tax rates on energy-intensive industries in Japan are twice those in the EU.
Network tariffs are especially likely to increase. The investment need up to 2030 for repowering European electricity grids has been estimated at €584 billion by the European Commission (2023b). To recover the costs of this investment through electricity bills, regulators will need to increase average network tariffs by 1.5 cents to 2 cents per kWh
13
This assumes financing costs between 5 percent and 7 percent for the period 2024-2030, and repayment of the principal in 40 years.
. If consumers pay this equally, the average rise in annual household electricity bills would be €40 to €50. If current trends continue, and additional network costs are shouldered disproportionately by households, the figure would be even higher. Reform of the EU electricity market design, agreed by the EU institutions in December 2023
14
See Council of the EU, ‘Electricity Market Reform’, https://www.consilium.europa.eu/en/policies/electricity-market-reform/.
, has also opened the path for substantial continued government support for renewables, which may be added to bills in the form of renewable tariffs (Zachmann et al, 2023).
In this context, European – particularly the French and German – governments are locked in discussions over the introduction of new tools to cut the price of electricity faced by domestic firms.
5 A French trait d’union and a German bridge too far
In France, the most significant mechanism affecting market prices was created in 2010 – the Regulated Access to Historic Nuclear Energy (ARENH) scheme. A large share of the French electricity supply comes from nuclear plants operated by the state-owned Électricité de France (EDF). From 2011 until 2025, ARENH allows competing electricity retail suppliers to buy electricity produced by EDF nuclear power plants at a fixed price (of €0.042/kWh), which they then sell on to final consumers. The volumes formally covered are 100 TWh
15
In reality the volumes sold by EDF at a regulated price are much higher. In 2022, EDF reported providing 120 TWh to alternative suppliers under ARENH and around an extra 55 TWh to households at regulated tariffs established under the French Energy Code, adding to the wholesale ARENH price capacity guarantees, transmission and marketing costs, as well as a normal rate of return on investment. Moreover, in 2022 EDF reported supplying 75 TWh at capped prices and about 25 TWh of grid losses also sold at the ARENH price (EDF, 2022, p.37).
, or approximately 25 percent of the country’s total production.
The distributional effects of ARENH depend on the price level and average annual cost of nuclear production from EDF. Analysis by the French Court of Auditors assessed that at the beginning of the scheme in 2011, the fixed price was above EDF’s cost of production (€0.032/kWh), hence it only limited excess profits. Since then, the average unit cost of production has increased and is by now above the fixed price set by ARENH (in 2021 the Court estimated EDF’s production cost at €0.047/kWh). The implication is that EDF makes a loss by selling power at an artificially lower price to competitors, deflating average prices.
In November 2023, EDF and the French government agreed on a mechanism to replace ARENH after its termination on 31 December 2025. The mechanism envisages a claw-back by taxing at 50 percent all the revenues made from the nuclear production fleet when the wholesale price goes above €78/MWh, and at 90 percent when the wholesale price is above €110/MWh. These thresholds were decided to guarantee consumers a net average wholesale price of about €70/MWh for the next 15 years. The price was deemed by the government to be adequate to deliver the decarbonisation and re-industrialisation of the country, including by reducing EDF’s debt and allowing for the construction of new nuclear power plants
16
See French government consultation document of 21 November 2021, ‘Projet de dispositif de protection des consommateurs d’électricité à partir du 1er janvier 2026’, https://www.ecologie.gouv.fr/sites/default/files/Consultation_publique_….
. Although a final legal text is not available at time of writing, it seems clear that the scheme will cover all existing nuclear generation, but will exclude new nuclear power plants such as Flamanville 3 in north-western France. Abandoning ARENH should also give EDF the opportunity to renegotiate and expand long-term contracts in their portfolio, targeting energy-intensive industrial consumers
17
André Thomas, ‘Prix de l’électricité : après son accord avec l’État, EDF devra convaincre ses clients industriels’, Ouest France, 22 November 2023; BFM Business, ‘EDF va proposer des contrats adossés à des actifs nucléaires aux plus gros consommateurs’, 21 November 2023, https://www.bfmtv.com/economie/entreprises/energie/edf-va-proposer-des-….
.
The revenues collected by the state from the new scheme will be redistributed among all consumers, though it is not yet clear what will the distribution key will be (but given the current government’s focus on re-industrialisation, one would expect industry to be the first beneficiary). To be compatible with EU competition law, the mechanism should redistribute revenues equitably to consumers based on their consumption
18
Even then, it might raise some concerns if effective electricity taxes are negative and hence below EU minimum values.
. The preliminary agreement envisages a central role for the French Commission for the Regulation of Energy, which will be in charge of estimating the exact production volumes and revenues of the nuclear fleet. Redistribution should also reward consumption during off-peak hours and by season, in order to encourage load shifting. The amounts would be redistributed to all end consumers in the form of a payment passed through suppliers with an obligation to pass it on.
In Germany, meanwhile, the extent to which government should use electricity policy to support energy-intensive firms has been debated extensively. In May 2023, the German ministry for Economic Affairs and Climate Action proposed a ‘bridge electricity price’ for energy-intensive firms. The idea was to guarantee to a selection of companies from energy-intensive industries a price of €0.06/kWh for 80 percent of their electricity consumption, to aid their international competitiveness. The subsidies would have amounted to between €2 billion and €9 billion annually
19
For our calculations, we assumed the subsidies would have covered the 2,200 energy- and trade-intensive companies that were exempted from paying the renewables levy in 2021. They consumed approximately 120 TWh (out of total German industrial demand of 220 TWh), 80 percent of which would be about 100 TWh.
.
However, this proposal was opposed by the German finance ministry and many economists (including Bernhardt et al, 2023). A finance ministry advisory board feared that excessive subsidies would impede necessary structural adjustment and highlighted that energy-intensive consumers already benefit from a variety of tax exemptions.
In November 2023, the government agreed in principle on a modified scheme. Electricity taxes would be reduced for all manufacturing companies to the EU minimum level of 0.05 eurocents per kWh (from 1.54ct/kWh). Most other European countries already have tax rates at the minimum level. Energy-intensive firms were largely exempt from the tax anyway, so this move is more beneficial for non-energy-intensive firms, which were paying the full rate.
The plan would also extend existing support measures for energy-intensive industries, based on reimbursing costs arising from European carbon taxes, but no fresh support would be given to energy-intensive firms. The government had already announced a €5.5 billion subsidy to stabilise network fees for all consumers
20
See German government press release of 9 November 2023, ‘Energie bezahlbar halten’, https://www.bundesregierung.de/breg-de/aktuelles/strompreispaket-energi….
.
The agreement was therefore focused on reducing electricity prices for all companies, rather than only energy-intensive companies. This suggests that concerns about harming overall economic growth by supporting only a handful of energy-intensive firms were heeded.
However, whether and when the plan will be implemented is unclear because of a November 2023 German Constitutional Court on strict enforcement of public financing limits
21
In Germany, a strict no-debt rule (the so-called ‘debt brake) is applied to government finances. On the impact of the Constitutional Court ruling on government climate spending, see Georg Zachmann, ‘Bypassing the German debt brake and continuing climate spending’, First Glance, 30 November 2023, Bruegel, https://www.bruegel.org/first-glance/bypassing-german-debt-brake-and-co….
. This might necessitate a new discussion of the planned electricity tax cuts.
6 Transforming European electricity: who will pay?
During the 2020s, governments will spend billions of euros transforming electricity grids. Exactly how to distribute these costs across society implies several trade-offs:
- Recovering costs through electricity tariffs or general taxation,
- The split of taxes between households and industry;
- The split of taxes between energy-intensive and the remaining industry,
- Cross-border impacts of subsidies; and,
- Trade-offs to consider when attracting clean technology manufacturing.
A first principle is that any tax exemption or public support for a certain consumer type implies an increase in costs for other consumers, for both fiscal and physical reasons. Fiscally, when one group is exempted from paying taxes, these taxes must be collected elsewhere. The physical reason relates to the functioning of electricity markets. Government subsidies reduce the incentives for recipients to reduce electricity consumption, through substitution, energy efficiency or relocation. In the short run (up to a few years), electricity supply is relatively fixed
22
Adding new generation capacities to the electricity grid takes a few years. Therefore, increasing electricity supply in the short run requires operating existing facilities at higher capacities. Concretely, this means raising output from natural gas and coal plants. Global natural gas markets remain very tight which limits room for manoeuvre, and raising output from coal plants is limited by environmental regulation as part of the EU’s ongoing phase out.
. Therefore, an increase in electricity consumption by one group must be offset by an equal decrease elsewhere, or prices for all other consumers increase, until demand and supply balance again.
6.1 Electricity tariffs vs general taxation
Currently, governments recover costs for renewable and grid subsidies by adding them to electricity bills (eg 'network tariffs'). The logic is that the costs of providing a good in addition to the good itself, such as electricity, should be met by those consuming it. For example, dedicated road-traffic taxes and charges generally pay for expenditure on road infrastructure for European countries (Schroten, 2017).
The alternative is to finance renewables, networks and other necessary investments through general taxation. Public goods such as education are funded in this way, based on the principle that they benefits society as a whole. A similar argument could be made for electricity consumption.
During 2022 and 2023, as electricity prices soared, many governments made the decision to temporarily shift electricity taxes onto the general budget
23
See Bruegel Dataset, ‘National fiscal policy responses to the energy crisis’, https://www.bruegel.org/dataset/national-policies-shield-consumers-risi…
. It remains to be seen whether this will set a precedent for the coming years. Electricity prices have dropped substantially and will likely drop further, suggesting tariffs might be revived. However, achieving climate goals requires households and companies to substantially increase electricity demand. Lowering tariffs on electricity bills is one option to encourage such behaviour.
6.2 Industry vs households
Within electricity markets, the starkest difference in tax treatment currently concerns households and companies (Figure 2). The standard decision European governments have taken is to impose a larger share of energy taxes on households to subsidise the electricity consumption of companies. As governments push households to consume more electricity, pressure will grow to reverse this policy.
In the past this was perceived as less of an issue as household electricity consumption was seen as a good proxy for affluence (relating to ownership of consumer goods) and consumers were not very sensitive to higher prices. This has changed as consumers can increasingly choose between ‘clean’ electricity for transport and heating, and fossil fuels. Hence, relative prices matter for the speed of the desired transition.
The average household in Germany currently consumes around 3,500 kWh electricity per year
24
See Benjamin Wehrmann, ‘What German households pay for electricity’, Clean Energy Wire, 16 January 2023, https://www.cleanenergywire.org/factsheets/what-german-households-pay-e….
. Before the crisis, with a typical household retail price of €0.20/kWh this resulted in an annual bill of €700. The same average household might have also spent €1,500 to fuel a car and €1,000 to heat their home with natural gas. The household will shift both expenses onto their electricity bill if they install a heat pump and buy an electric car. A heat pump is estimated to increase consumption by 4,900 kWh and an electric car by 3,000 kWh. Therefore, while the average household energy bill would decrease, electrification implies that the annual average household electricity bill may grow from €700 to €2,300
25
Household consumption increases from 3,500 kWh per annum to 11,400 kWh. A heat pump increases consumption by 4,900 kWh (Schlemminger et al, 2022) and an EV by 3,000 kWh, if driving 15,000 km at 195Wh/km (see https://ev-database.org/cheatsheet/energy-consumption-electric-car). Constant price of 0.20 eurocents per kWh. Average fuel price for car estimated as 15,000 km driven at six litres per 100km efficiency and a fuel price of €1.70/litre. Natural gas consumption assumed at 12,000 kWh with a retail price of 8 eurocents per kWh.
. Distributional decisions on renewable tariffs will become much more relevant.
6.3 Taxing energy-intensive vs general industry
Governments also decide to distribute costs between industry depending upon the volume of their energy consumption. Typically, this involves lowering the bills of energy-intensive firms. The rationale is that for these firms, energy costs make up a large share of final production costs, and typically they face substantial international competition. Providing them with cheaper access to energy is seen as necessary for keeping them competitive on global markets. The relative importance of energy-intensive industries varies significantly across the EU, which influences rates of taxation (see the annex).
The economic logic of subsidising energy-intensive firms is controversial. Some level of support is justified as compensation for the higher carbon costs in the EU compared to international competitors. However, companies that are energy intensive typically produce lower value added per unit of electricity consumption. They also employ fewer people (Figure 3 summarises this for Germany). Therefore, any intervention which raises electricity consumption by such firms has the first-order effect of shifting consumption toward firms that transform electricity into lower value added, potentially slowing down economic growth. There is a risk of path-dependency where subsidies become locked in (Fouquet, 2016).
Figure 3: German energy-intensive vs non-energy-intensive industries (% of total industry value)
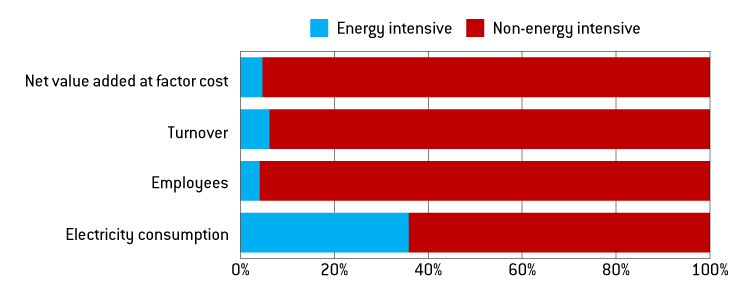
Source: Bruegel on DeStatis data. Note: energy-intensive industries include the following WZ codes 1411, 1711, 1712, 1920, 2011, 2013, 2016, 2314, 2410, 2442, 2443, 2444, 2445, 2451.
There are two counterarguments to this. The first is that the view ignores second-order effects, and the second is that the goods produced by energy-intensive industries have ‘economic security’ value. The second-order effects argument is that energy-intensive firms produce goods that are a vital inputs for manufacturing stages further along the value chain. The argument follows that if energy-intensive firms were to slow production, there would be ripple effects onto other sectors of the economy (Krebs, 2023).
We question this argument on intuitive and empirical grounds. Intuitively, one of the most prominent arguments for energy-intensive subsidies is that firms face fierce international competition. This suggests well supplied markets in which international competitors could replace domestic production.
The energy price shock of 2022 provided an empirical test of this hypothesis. The result was that substantial drops in industrial production from energy-intensive firms were not passed through to the rest of the economy. In 2023, output from energy-intensive manufacturing in the EU was 14 percent less than in 2021, while output from overall manufacturing increased by 3 percent
26
Author’s analysis on Eurostat database sts_inpr_m.
. This evidence is a strong rebuttal of the argument that domestic supply chains depend on local energy-intensive production. It suggests a reality in which trade and substitution along value chains mutes any impact. A detailed description of this is found in Moll et al (2023), who found overall industrial production to be decoupled from production in energy-intensive sectors.
The second counterargument is that certain products are critical to a country's economic security and should be protected. This argument has merit; however, the definition of a product’s contribution to a country’s economic security is more nuanced than simply that sector’s average consumption of electricity. While there may be a correlation between electricity consumption and contribution to economic security, it is not one-for-one. Supporting an industry or firm on the grounds of economic security should instead be on a case-by-case basis.
6.4 Between European countries
EU governments have different capacities to support national industries. The absence of European coordination runs the risk of an intra-European subsidy race that will harm the internal market and especially those countries with more limited fiscal space (similarly to what happened in the semiconductor sector; Garcia-Herrero and Poitiers, 2022). The consequences will be to artificially increase the competitiveness of energy-intensive companies in countries that offer support, relative to European neighbours.
The dynamics discussed above in relation to skewing electricity consumption away from other consumers very much also apply between countries. Any increase in one country's consumption means that other countries in the internal electricity market must consume less and will face higher electricity prices. The situation is like that during the energy crisis when European governments competed in a subsidy race, which ultimately raised the price of a limited supply of gas.
6.5 Whether to attract clean technology manufacturing
The production of many clean technologies involves electricity-intensive manufacturing stages, such as the refining of polysilicon for solar panels, or the production of battery cells. The EU’s proposed Net Zero Industry Act (NZIA; not yet finalised at time of writing) would set a goal for domestic manufacture of at least 40 percent of total EU demand in most clean-technology sectors. European governments are rolling out subsidies to attract clean-technology factories.
Just like legacy energy-intensive production, this new wave of clean tech will face the same dynamics in competing for electricity generation. The numbers are substantial. Meeting 40 percent of the EU's solar supply domestically will require the capacity to refine polysilicon for producing 30 GW solar wafers, which will consume around 24,000 GWh per year or 1 percent of total EU electricity demand today
27
Assuming 3,000 tonnes of polysilicon are required per gigawatt of solar wafer capacity, and 270kWh electricity is required to refine 1kg of polysilicon (Hallam et al, 2022).
. Meanwhile meeting 40 percent of battery demand will require 220 GWh cell production, consuming 13,000 GWh per year or 0.5 percent of current EU electricity demand
28
Assuming 60 kWh electricity demand per kWh cell production (Davidsson Kurland, 2019).
. This does not take into account the additional electricity requirements for raw material extraction and refining. The huge energy consumption of these facilities implies a major role for policy and industry in deciding where to locate them.
7 Conclusions
Germany and France have so far resisted the temptation to generously subsidise energy-intensive industry. This is good news. This would have had consequences for the integrity of the European single market and non-energy intensive domestic consumers.
Their debates show that electricity policy is central to industrial policy. This will become even more the case in the coming years. First, electricity’s share of final energy demand will grow, with transport and demand sectors in particular shifting consumption to electricity. Second, the share of renewables will grow. This implies that actual market prices will decrease. However, there will be a growing share of taxes for governments to distribute between consumers.
We identify the following five areas as critical for framing future debates on electricity pricing policy: i) recovering expenses via electricity tariffs or general taxation, ii) the relative tax split between households and industry, iii) the relative tax split between energy-intensive and non-energy-intensive industry, iv) the cross-border effects of one country’s subsidies, and v) high electricity consumption associated with the manufacture of clean technologies that Europe is looking to attract.
References
Bernhardt, L.,T. Duso, R. Sogalla and A. Schiersch (2023) ‘Broad Electricity Price Subsidies for Industry are not a Suitable Relief Instrument, DIW Weekly Report, S. 257-265
Davidsson Kurland, S. (2019) ‘Energy use for GWh-scale lithium-ion battery production’, Environmental Research Communications, 2:012001
Cour des comptes (2022) Organisation Of The Electricity Markets, Public policy evaluation, July, available at https://www.ccomptes.fr/en/documents/61774
EDF (2022) Résultats Annuels 2022, Électricité de France, available at https://www.edf.fr/sites/groupe/files/2023-03/resultats-annuels-2022-presentation-2023-03-10.pdf
ENTSO-E (2022) European Resource Adequacy Assessment 2022 Edition, available at https://www.entsoe.eu/outlooks/eraa/2022/
European Commission (2020) Energy costs, taxes and the impact of government interventions on investments, Directorate-General for Energy, available at https://op.europa.eu/en/publication-detail/-/publication/76c57f2f-174c-11eb-b57e-01aa75ed71a1/language-en
European Commission (2020b) ‘Stepping up Europe’s 2030 climate ambition. Investing in a climate-neutral future for the benefit of our people’, SWD(2020) 176 final, available at: https://eur-lex.europa.eu/resource.html?uri=cellar:749e04bb-f8c5-11ea-991b-01aa75ed71a1.0001.02/DOC_1&format=PDF
European Commission (2022) ‘Non paper on complementary economic modelling undertaken by DG ENER analysing the impacts of overall renewable energy target of 45% to 56% in the context of discussions in the European Parliament on the revision of the Renewable Energy Directive’, Ares(2022)4520846, available at https://energy.ec.europa.eu/system/files/2022-06/2022_06_20%20RED%20non-paper%20additional%20modelling.pdf
European Commission (2023a) ‘2023 Report on Energy Subsidies in the EU’, COM(2023) 651 final, available at https://energy.ec.europa.eu/system/files/2023-10/COM_2023_651_1_EN_ACT_part1_v4.pdf
European Commission (2023b) ‘Grids, the missing link - An EU Action Plan for Grids’, COM(2023) 757 final, available at https://eur-lex.europa.eu/legal-content/EN/TXT/HTML/?uri=COM:2023:757:FIN
Fouquet, R. (2016) ‘Path dependence in energy systems and economic development’, Nature 1:16098
German Ministry of Finance (2023) 29. Subventions-bericht des Bundes 2021 – 2024, available at https://www.bundesfinanzministerium.de/Content/DE/Downloads/Broschueren_Bestellservice/29-subventionsbericht.pdf?__blob=publicationFile&v=8
García-Herrero, A. and N. Poitiers (2022) ‘Europe’s promised semiconductor subsidies need to be better targeted’, Bruegel Blog, 17 October, available at https://www.bruegel.org/blog-post/europes-promised-semiconductor-subsidies-need-be-better-targeted
Gasparella, A., D. Koolen and A. Zucker (2023) ‘The Merit Order and Price-Setting Dynamics in European Electricity Markets’, European Union JRC Science for Policy Brief, JRC134300
Hallam, B., M. Kim, R. Underwood, S. Drury, L. Wang and P. Dias (2022) ‘A Polysilicon Learning Curve and the Material Requirements for Broad Electrification with Photovoltaics by 2050’, Solar RRL, 6, 2200458
Krebs, T. (2023) ‘Öknomische Analyse einer Verlängerung und Modifizierung der Strompreisbremse’, Hans Böckler Stiftung, 305
McWilliams, B., G. Sgaravatti, S. Tagliapietra and G. Zachmann (2023) ‘The European Union is ready for the 2023-24 winter gas season’, Bruegel Analysis, 10 October, available at https://www.bruegel.org/analysis/european-union-ready-2023-24-winter-gas-season
Moll, B., M. Schularick and G. Zachmann (2023) ‘The power of substitution: The Great German Gas debate in retrospect’, Brookings BPEA Conference draft, available at: https://www.brookings.edu/articles/the-power-of-substitution-the-great-german-gas-debate-in-retrospect/
Schroten, A. (2017) Road taxation and spending in the EU, Transport Economics CE Delft
Schlemminger M., T. Ohrdes, E. Schneider and M. Knoop (2022) ‘Dataset on electrical single-family house and heat pump load profiles in Germany’, Nature 9:56
Sgaravatti, G., S. Tagliapietra, C. Trasi and G. Zachmann (2021) ‘National policies to shield consumers from rising energy prices’, Bruegel Datasets, first published 4 November 2021, available at https://www.bruegel.org/dataset/national-policies-shield-consumers-rising-energy-prices
Zachmann, G., L. Hirth, C. Heussaff, I. Schlecht, J. Mühlenpfordt and A. Eicke (2023) The design of the European electricity market – Current proposals and ways ahead, Study for the European Parliament ITRE Committee, available at https://www.europarl.europa.eu/RegData/etudes/STUD/2023/740094/IPOL_STU(2023)740094_EN.pdf
Annex A1: Country variation in the importance of energy-intensive industries
The importance of the energy-intensive industrial sector in overall electricity consumption varies by country within the EU. The share is highest in Germany with 25 percent of electricity consumption going to energy-intensive firms, and lowest in France at just over 10 percent. Energy-intensive electricity demand in Germany is almost equal to total Polish electricity demand, or half of total Spanish electricity demand (Figure 1A).
Figure A1: Share of electricity consumption by consumer type, TWh, 2021 (totals)
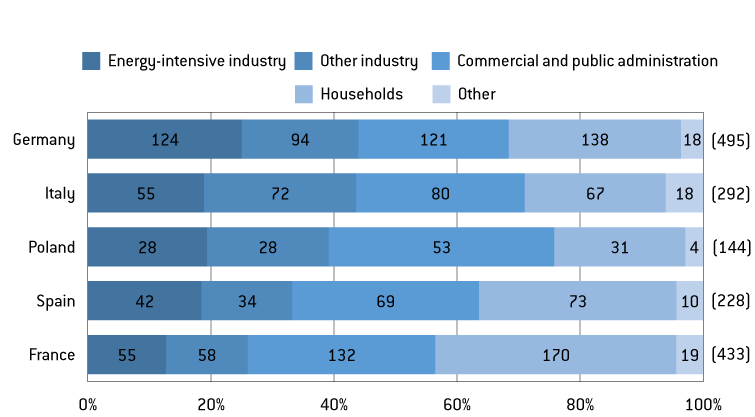
Source: Bruegel based on Eurostat. Note: energy-intensive industry includes basic metals, chemicals, non-metallic minerals and paper and pulp.
