The impact of the oil-price shock on net oil exporters
In the second half of 2014 and early 2015, international oil prices approximately halved. What have been the consequences of this sharp decline on net
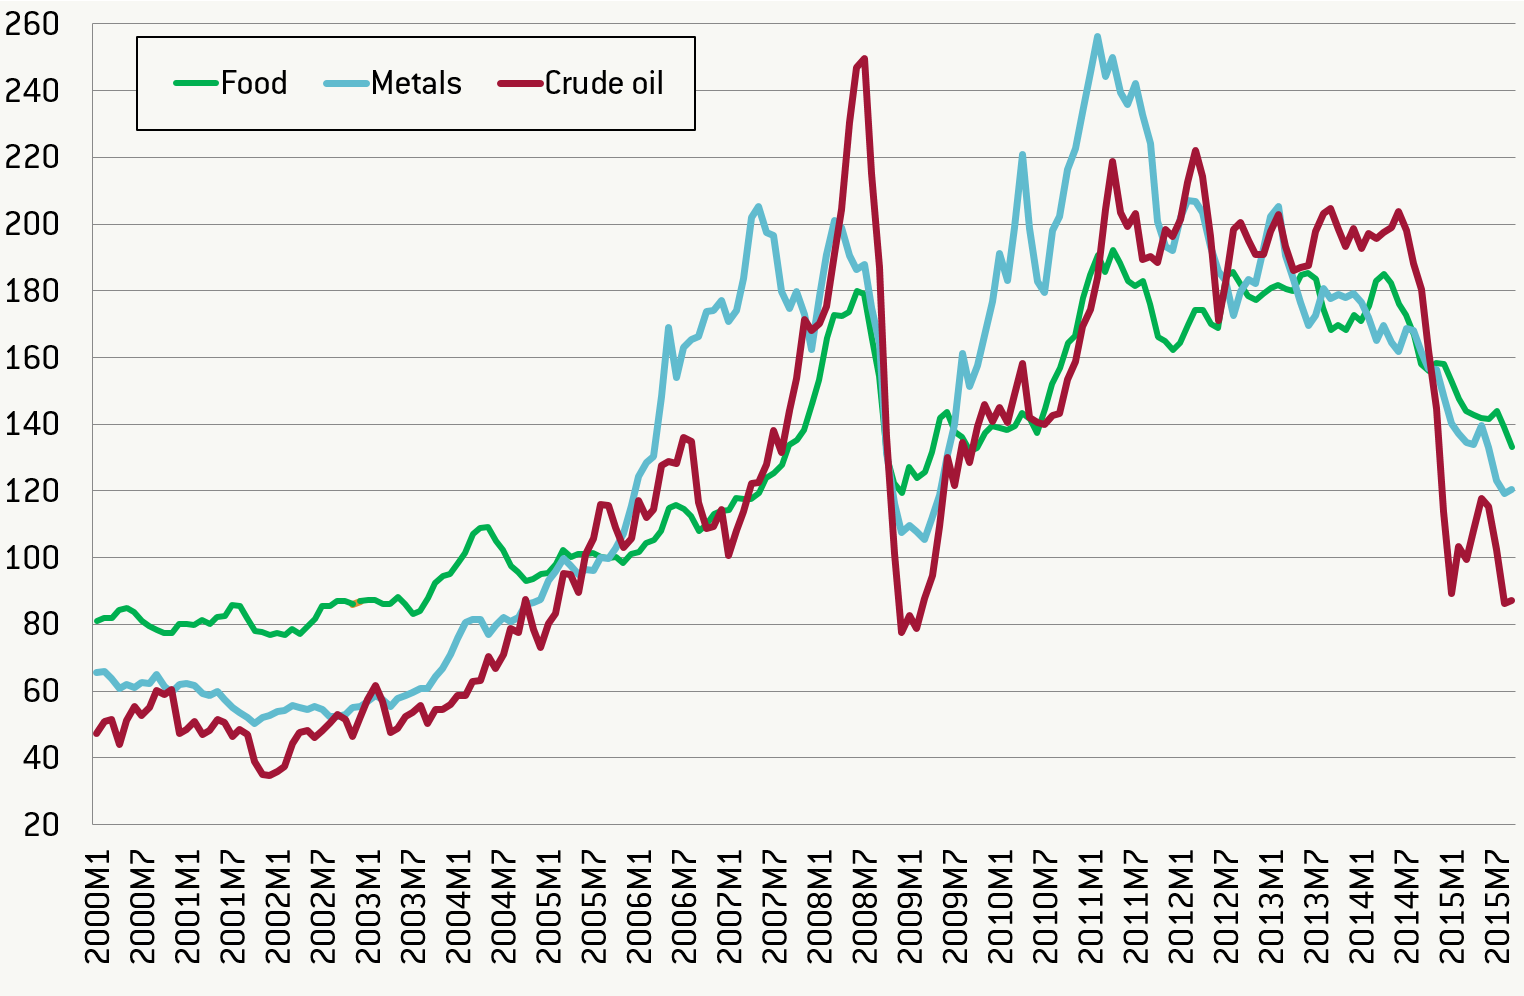
The sharp decline in oil prices in 2014-2015 (Figure 1) generated a heavy macroeconomic shock on net oil exporters, especially those whose GDP and exports are dominated by oil.
We analysed changes in key macroeconomic and fiscal indicators of selected oil producers between 2013 (the last full year of high oil prices) and 2015 (the first full year of low oil prices) as reported in the October 2015 edition of the IMF World Economic Outlook database[1] and other IMF and World Bank data sources[2]. Our analysis included changes in real GDP, current account balances, international reserves, general government (GG) balances, gross and net GG debt, changes in nominal exchange rates and inflation. Based on these variables we were able to draw a tentative picture of the differentiated impact of oil price shock on individual oil exporters, and their policy responses.
Our analysis covers only partly those oil exporters that are either affected by wars and conflicts (Iraq, Libya, Sudan and Syria) or represent largely non-market economic systems and policies with domestic price controls, multiple exchange rates and heavy import and export restrictions (Venezuela and Iran)[3]. For obvious reasons, they are not fully comparable with other countries and their statistical data is often incomplete and of insufficient quality.
Naturally, the short period of time that has passed since the beginning of the oil price drop does not allow for definite conclusions to be drawn on its impact on individual economies. Moreover, data for 2015 comes from the IMF World Economic Outlook forecast and, for some countries, data for 2014 and earlier years comprises preliminary estimates.
The depth of the oil-price shock
In the second half of 2014 and early 2015, international oil prices approximately halved (see Figure 1). That is, the depth of the oil-price shock looks comparable with that of the second half of 2008 and early 2009. However, while the 2008-2009 shock resulted from a temporary liquidity crisis caused by the Lehman Brothers bankruptcy, the current shock seems to be underpinned by more fundamental demand- and supply-side factors.
On the demand side, there are the observed slowdowns of emerging-market economies, effects of energy-saving policies in developed and developing countries, and the gradual tightening of US monetary policy, which reduced the appetite for speculative purchases of oil and other commodities. In speaking about the demand side, we mean massive investment in new oil-production capacities, including shale oil, in the last two decades (Dale, 2015), the declining market power of the OPEC cartel and development of alternative energy sources.
Consequently, the lower level of oil prices could reflect a new market equilibrium and could last longer than the short-term price declines of 1998-1999 and 2008-2009. The current situation is more reminiscent of the dramatic oil price adjustment observed in the mid-1980s, after which low prices dominated for more than a decade. If this scenario is repeated now, all net oil exporters will face inevitable challenges of both macro- and microeconomic adjustment in the long term.
Figure 1: Commodity price indices, 2000-2015 (2005 = 100)

Source: IMF Primary Commodity Price System, http://www.imf.org/external/np/res/commod/External_Data.xls
Oil dependence
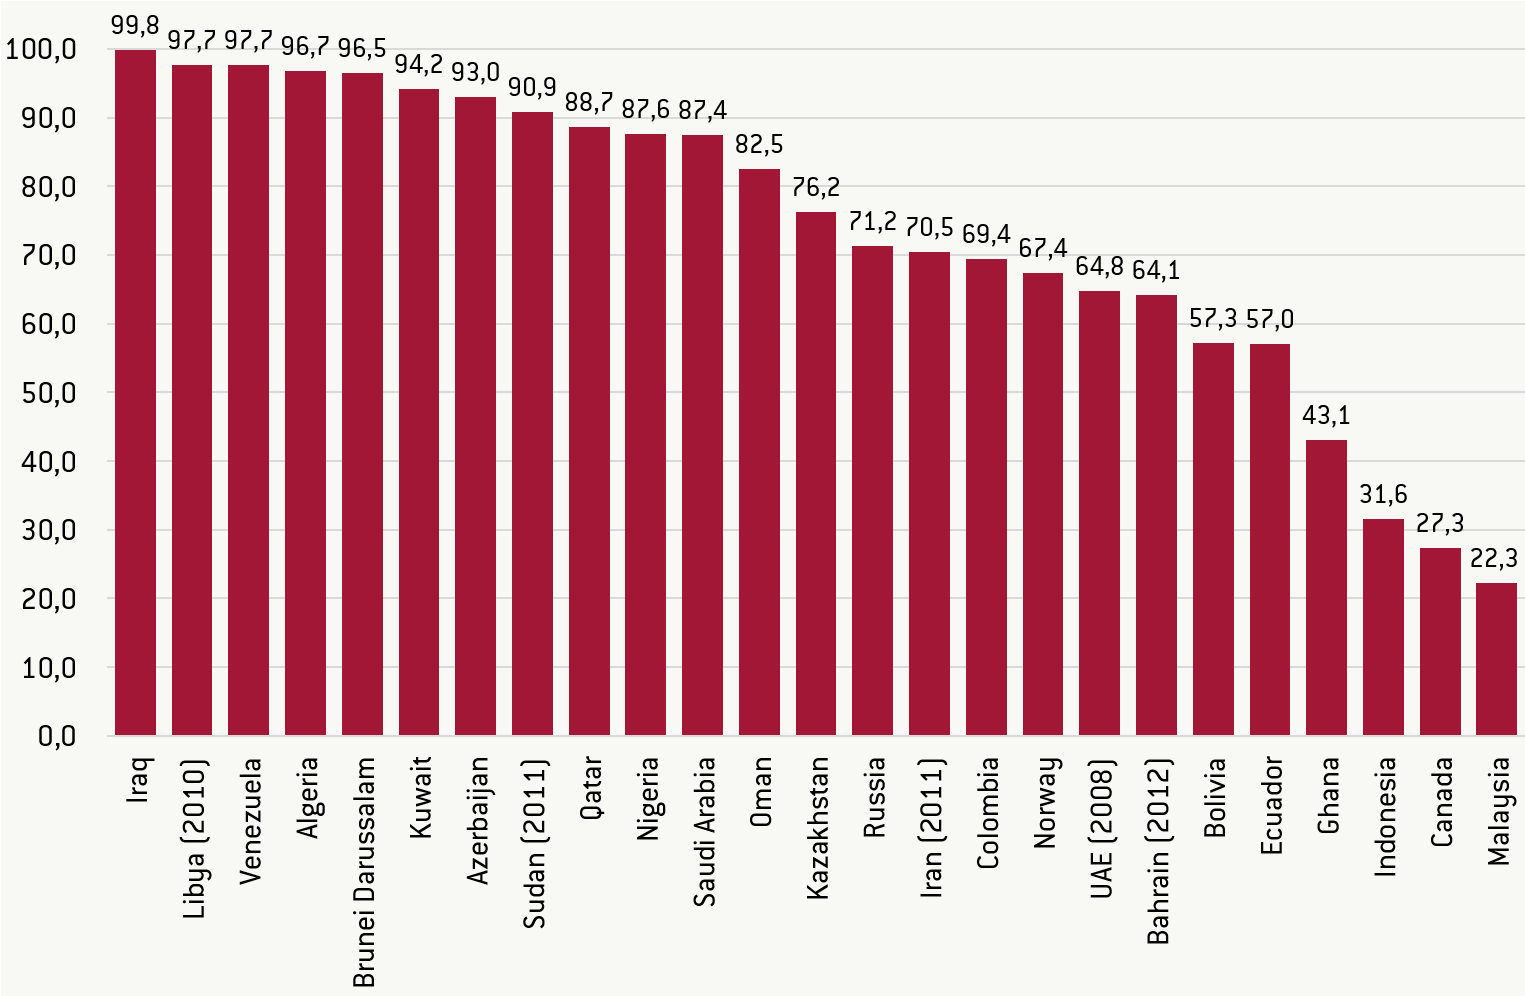
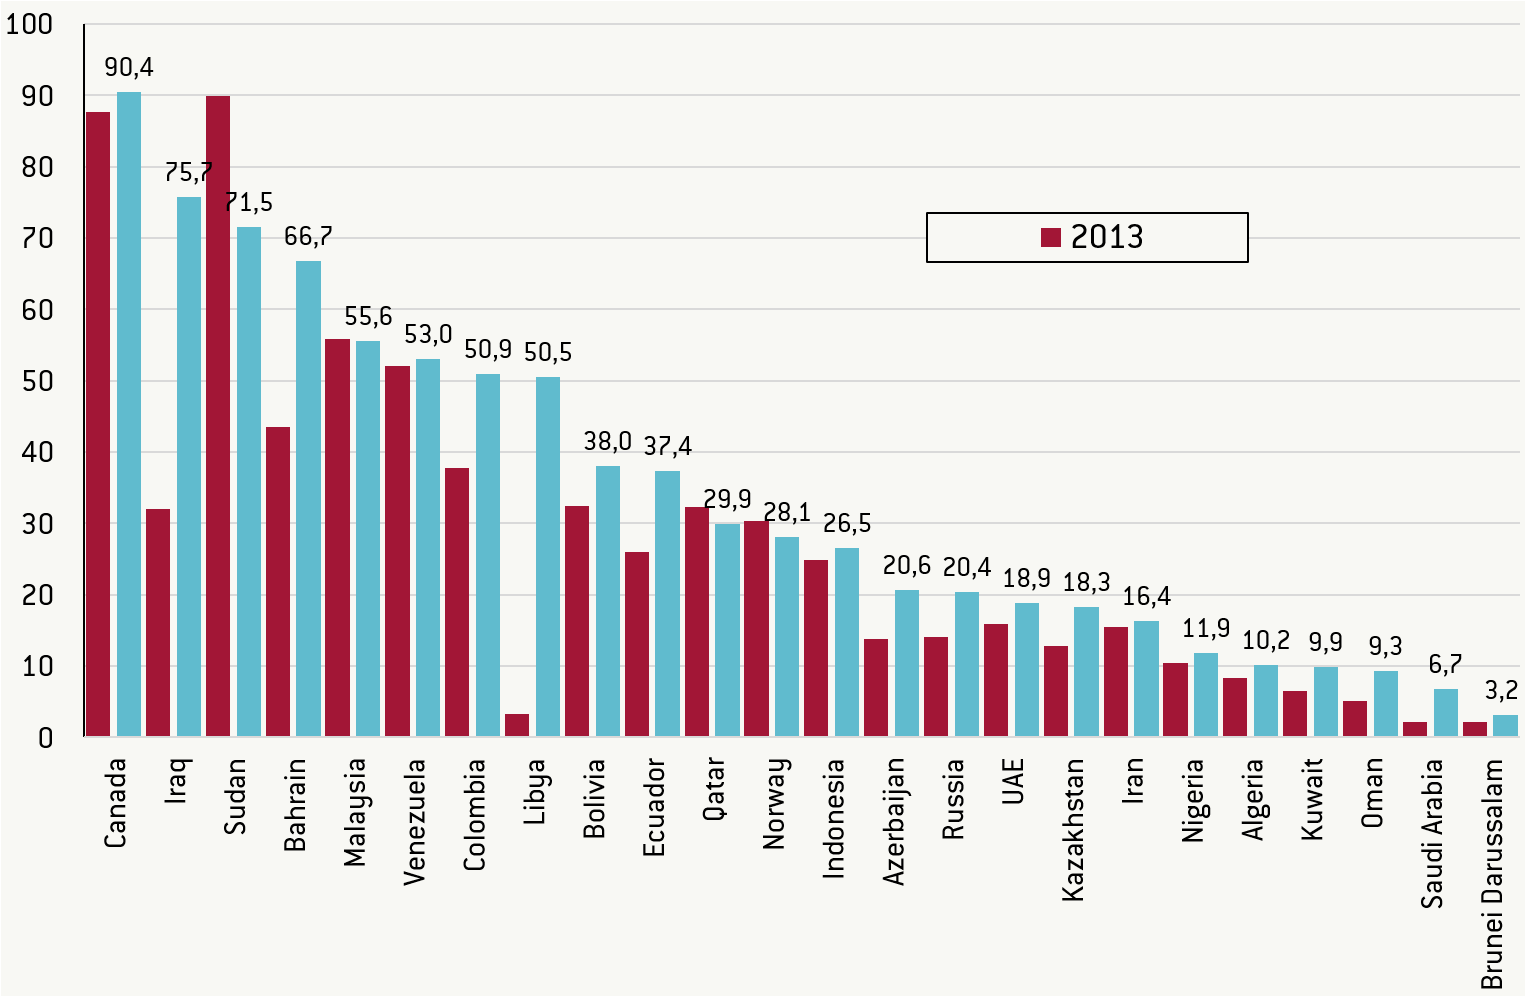
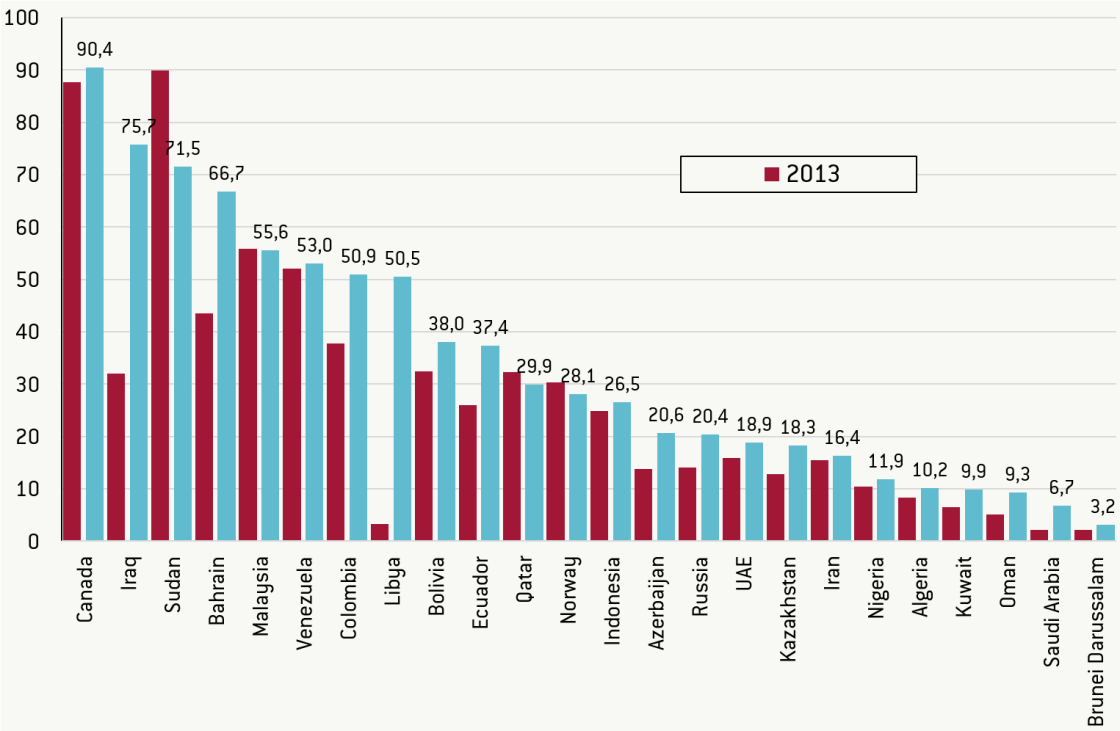
Figure 2 shows countries by their dependence on exports of fuel commodities, which include, apart from oil and oil products, natural gas and coal[4]. One can distinguish five groups of countries:
- ‘Monoculture’ exporters (the share of fuel exports exceeds 90 percent of total exports): Algeria, Azerbaijan, Brunei Darussalam, Iraq, Kuwait, Libya, Sudan and Venezuela;
- Very high dependence (between 80 and 90 percent): Nigeria, Oman, Qatar and Saudi Arabia;
- High dependence (between 60 and 80 percent): Bahrain, Colombia, Iran, Kazakhstan, Norway, Russia and the United Arab Emirates (UAE);
- Moderate dependence (between 40 and 60 percent): Bolivia;
- Limited dependence (below 40 percent): Canada, Indonesia and Malaysia.
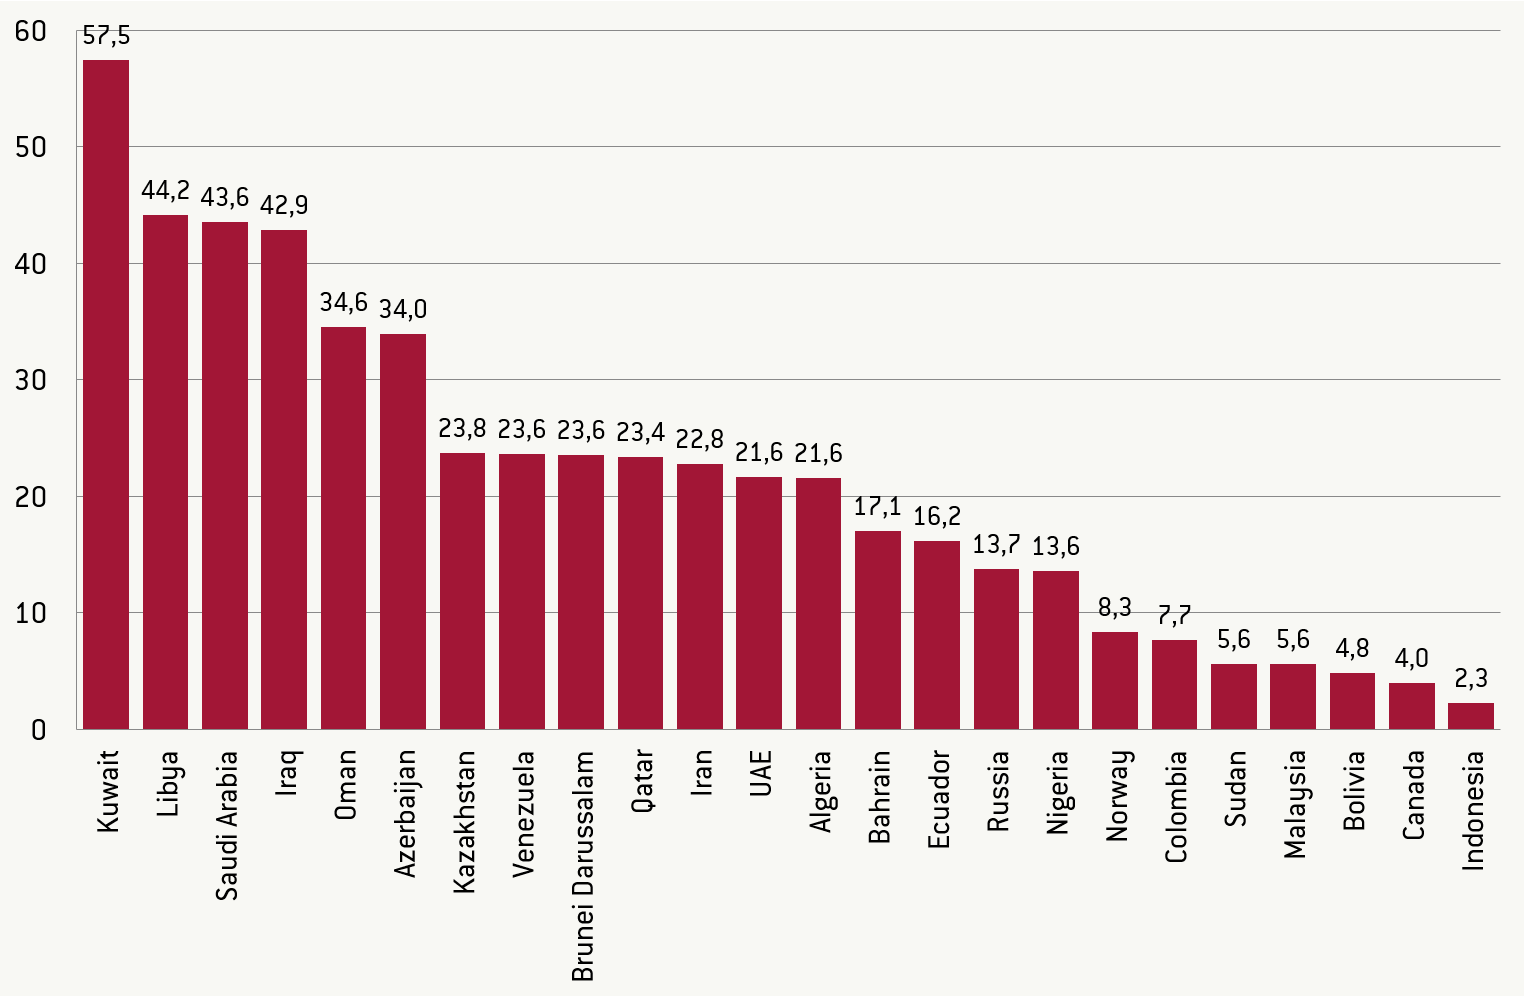
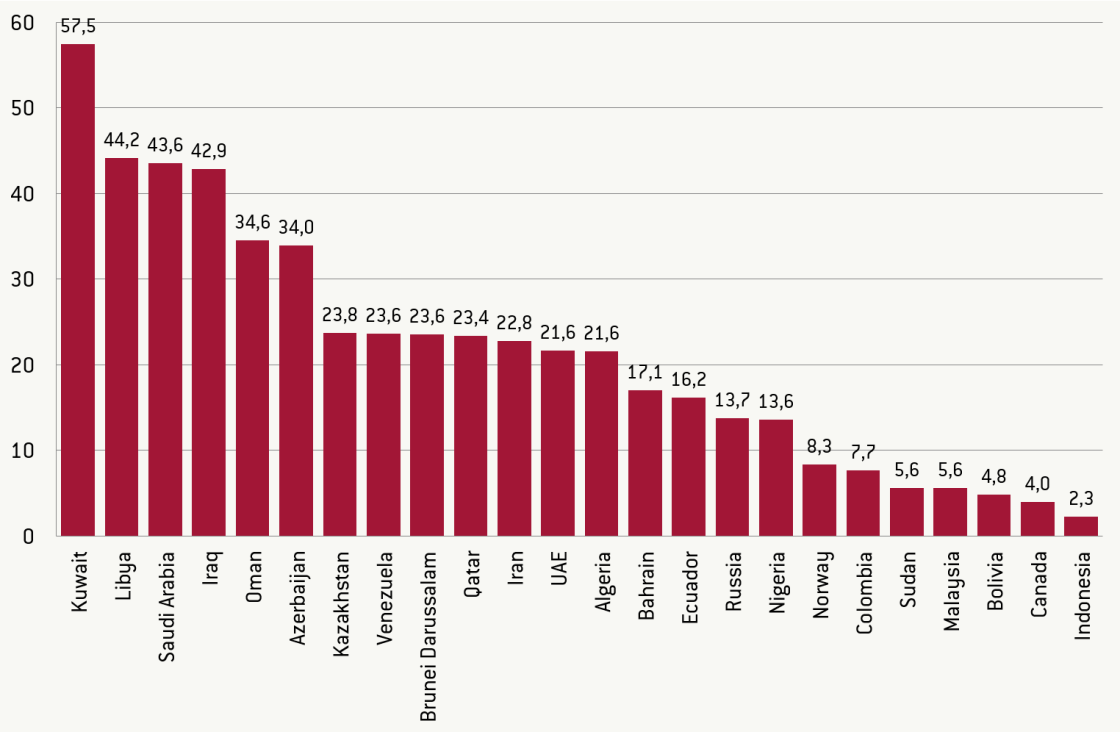
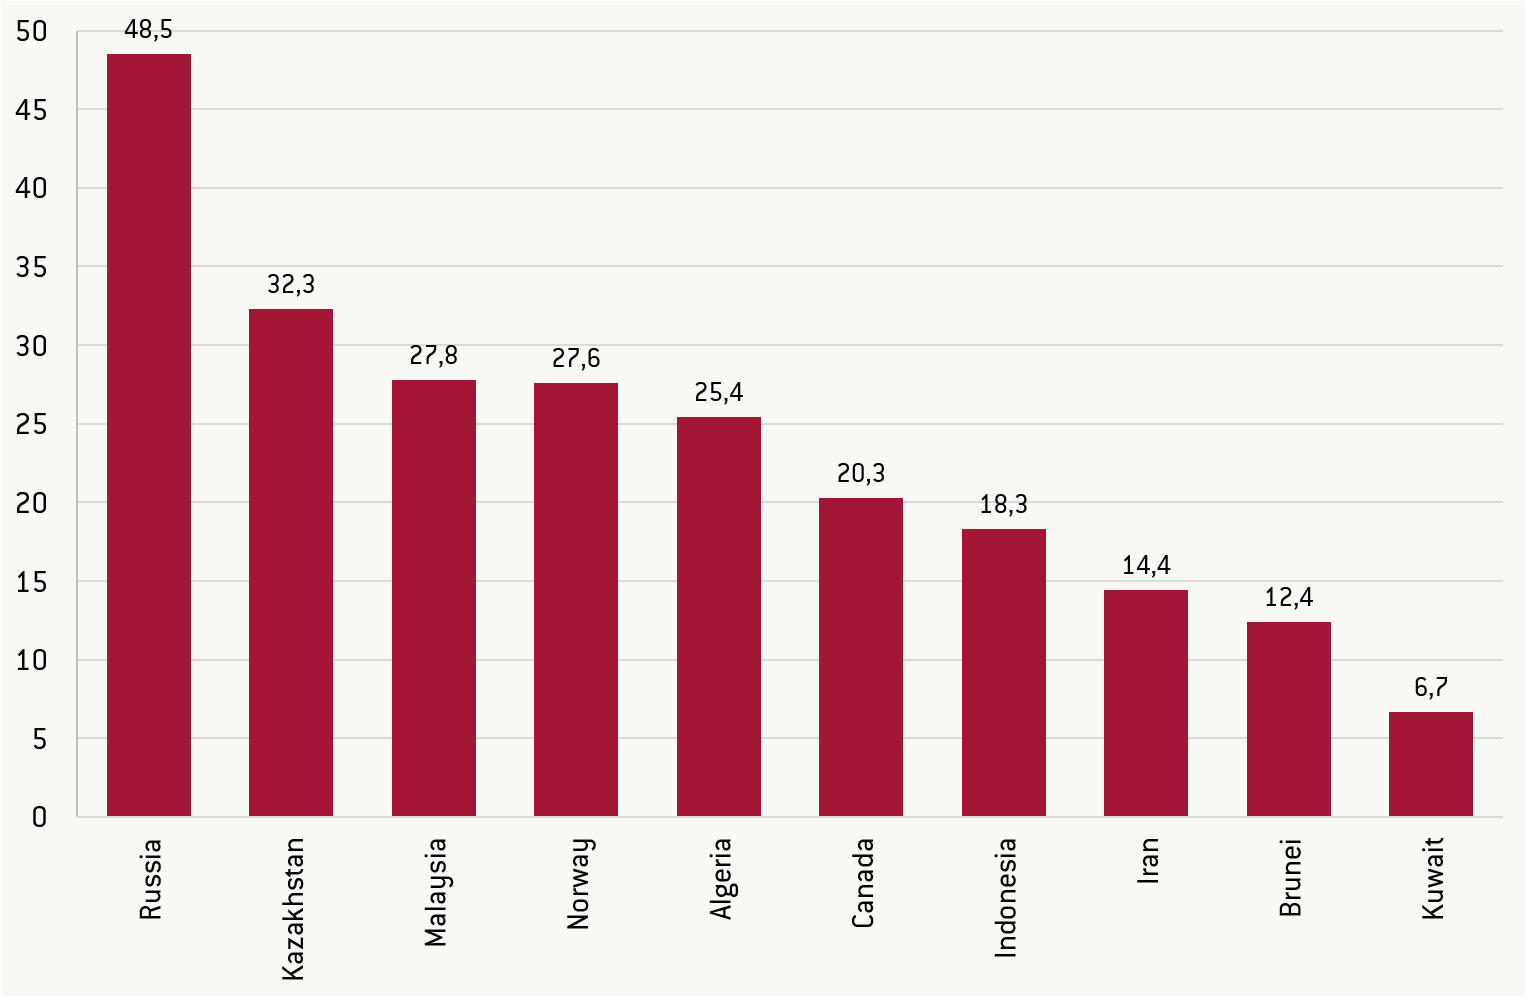
To understand the potential impact of changes in oil prices on GDP dynamics and fiscal accounts, we also analyse data on the size of oil related rents in 2013 (Figure 3). Based on this, we can distinguish four groups of oil producers.
The first group includes countries with the greatest dependence on oil rents (over 30 percent of GDP): Kuwait, Libya, Saudi Arabia, Iraq, Oman and Azerbaijan. In the second group, the share of oil rents in GDP varies between 20 and 30 percent: Algeria, Brunei Darussalam, Iran, Kazakhstan, Qatar, UAE and Venezuela. The third group is characterised by a moderate dependence (between 10 and 20 percent of GDP) and includes Bahrain, Ecuador, Nigeria and Russia. The fourth groups represents countries with an oil rent share below 10 percent of GDP, ie Bolivia, Canada, Colombia, Indonesia, Malaysia, Norway and Sudan.
Figure 2: Fuel exports as percentage of merchandise exports, 2013 unless otherwise indicated
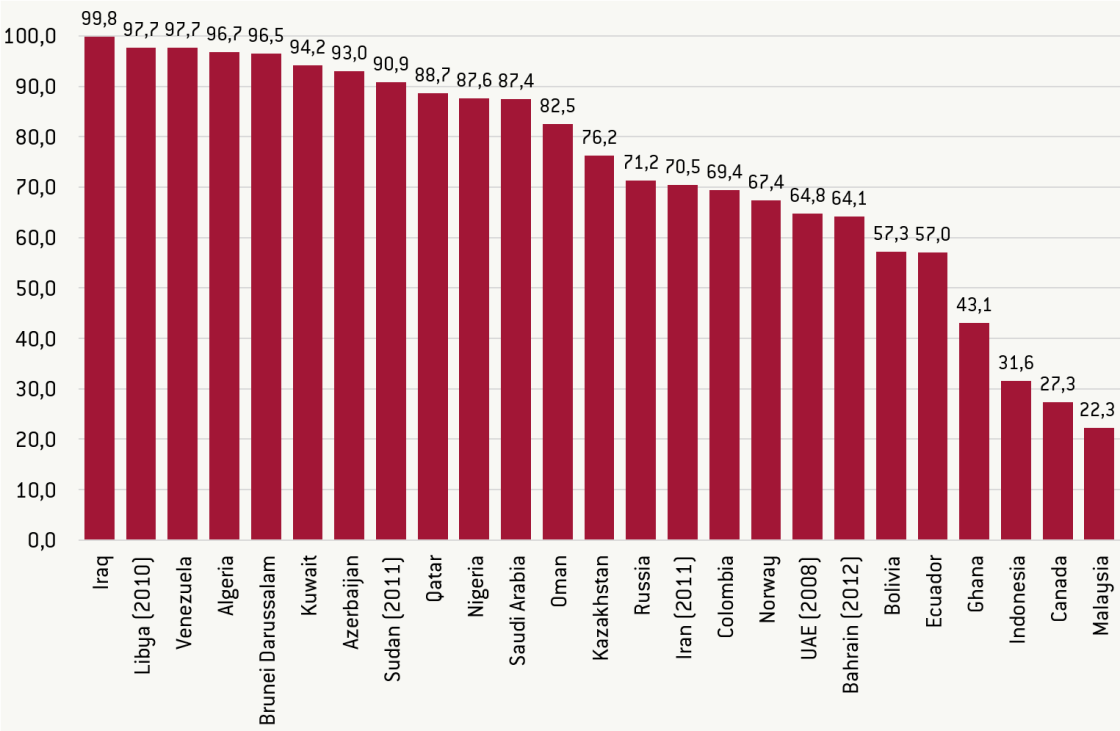
Source: World Bank World Development Indicators, http://data.worldbank.org/indicator/TX.VAL.FUEL.ZS.UN
Figure 3: Oil rent as percent of GDP, June 2013
Source: World Bank World Development Indicators, http://databank.worldbank.org/data/reports.aspx?source=world-development-indicators#
To make the picture even more complicated, it is worth noting that several fuel exporters (Canada, Indonesia, Kazakhstan, Malaysia and Russia) are also net exporters of other commodities such as metals and agricultural products, the prices of which have also declined (Figure 1). Thus, they have had to absorb adverse shocks not only from the oil market.
Economic slowdown
As we have noted, the impact of oil price shocks on macroeconomic performance differs between individual net oil exporters.
Differences result from the combination of various economic and political factors. Economic factors include, the structural characteristics of individual economies (especially, the degree of their dependence on oil production and exports – see the previous section), the quality of macroeconomic fundamentals such as fiscal and external balances and the size of monetary and fiscal buffers accumulated in boom periods, and policy responses to oil price decline. Political factors include non-economic shocks such as wars, internal conflicts or political instability.
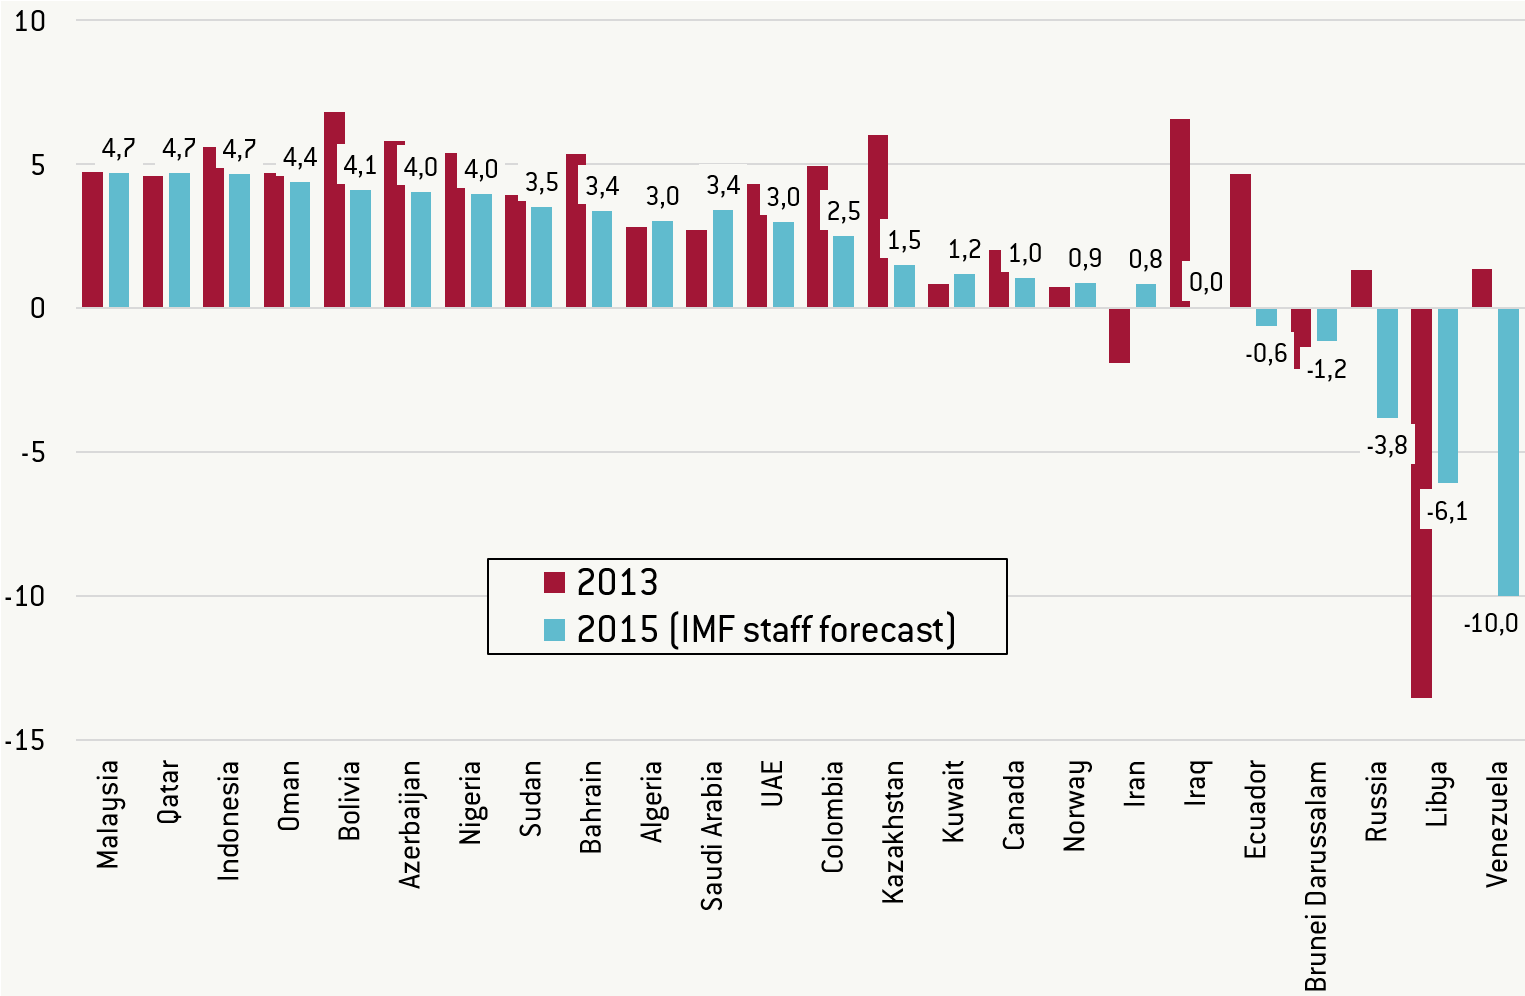
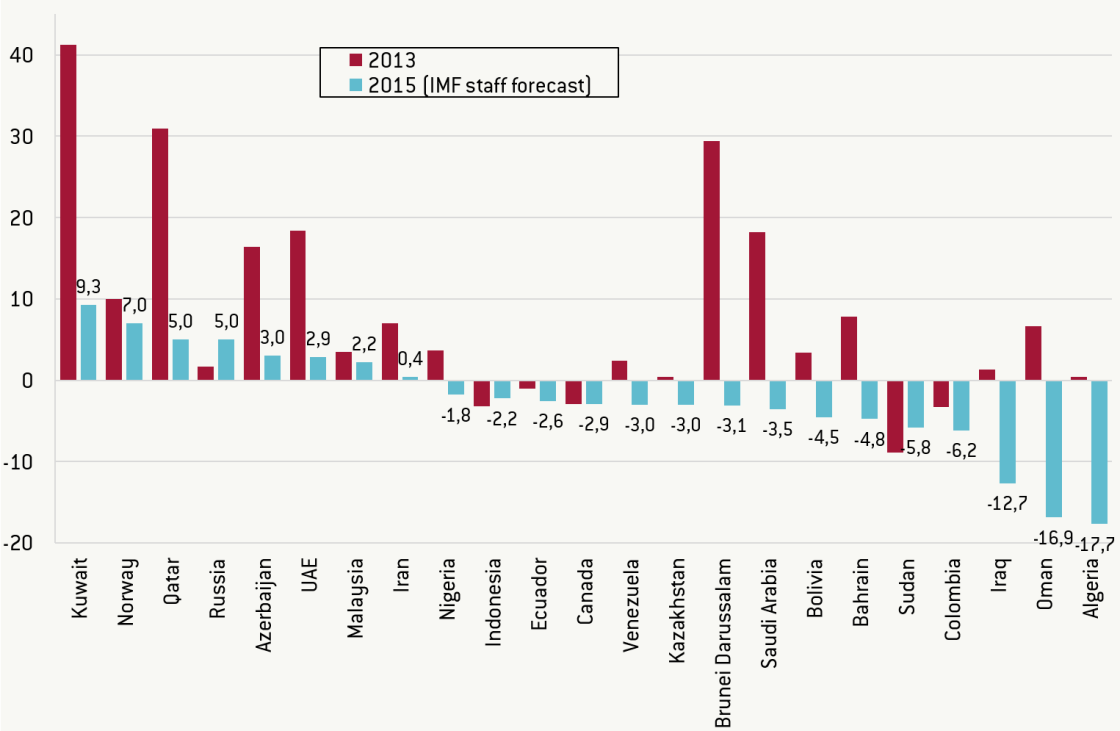
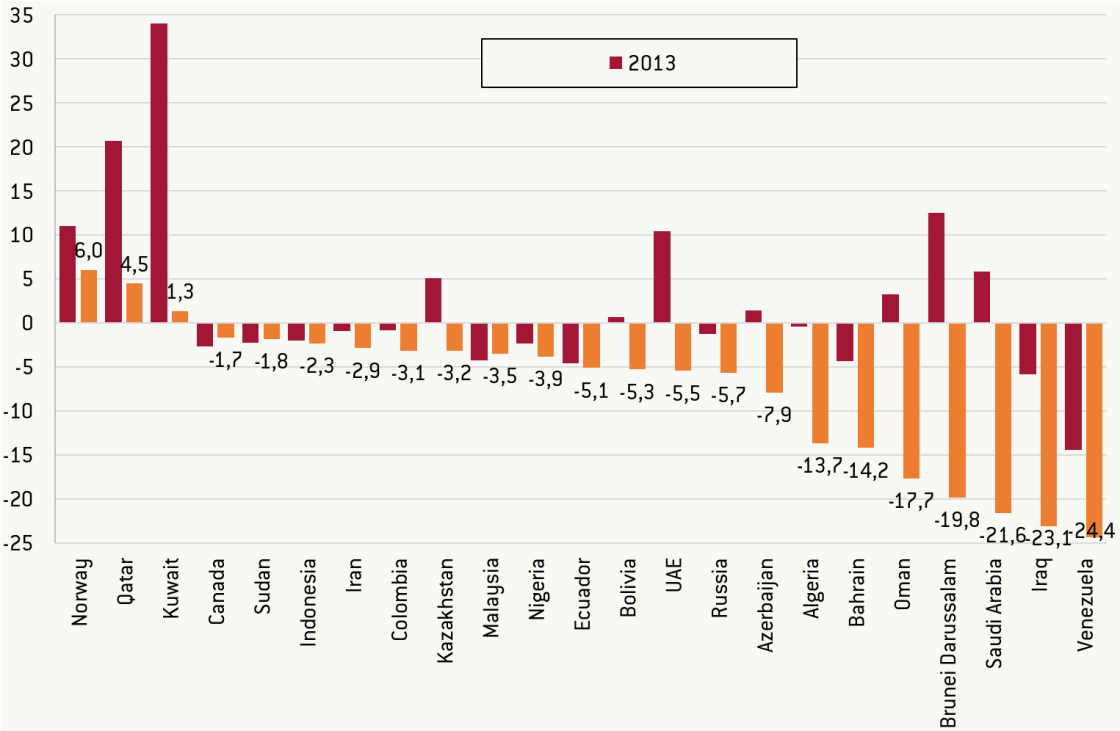
Figure 4: Annual changes in real GDP, in percent, 2013 and 2015
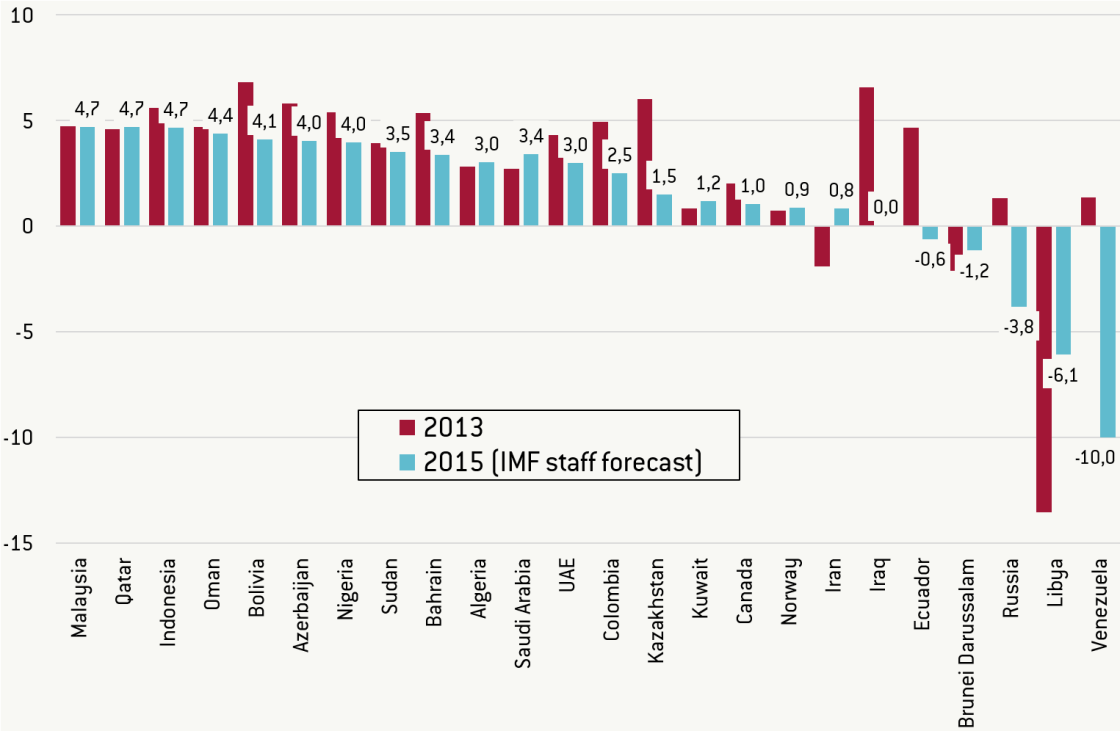
Source: IMF World Economic Outlook database, October 2015
As Figure 4 shows, most oil exporters who have not been seriously affected by wars and conflicts and have not experimented with populist policies, have been relatively resilient in terms of their GDP dynamics against oil price changes. Only Russia, Ecuador and Kazakhstan can expect major negative changes in their growth rates. The first two will experience output decline in 2015. Limited growth deceleration can be observed in Azerbaijan, Bahrain, Bolivia, Canada, Colombia, Indonesia, Nigeria and UEA. Other countries such as Algeria, Kuwait, Malaysia, Norway, Oman, Qatar, and Saudi Arabia will record either a continuation of the growth rate recorded in 2013, or even modest improvement. Most likely, relative growth resilience can be attributed to the structural diversity and microeconomic flexibility of a given economy, or to aggressive countercyclical fiscal policies (see below).
Balance-of-payments weakening
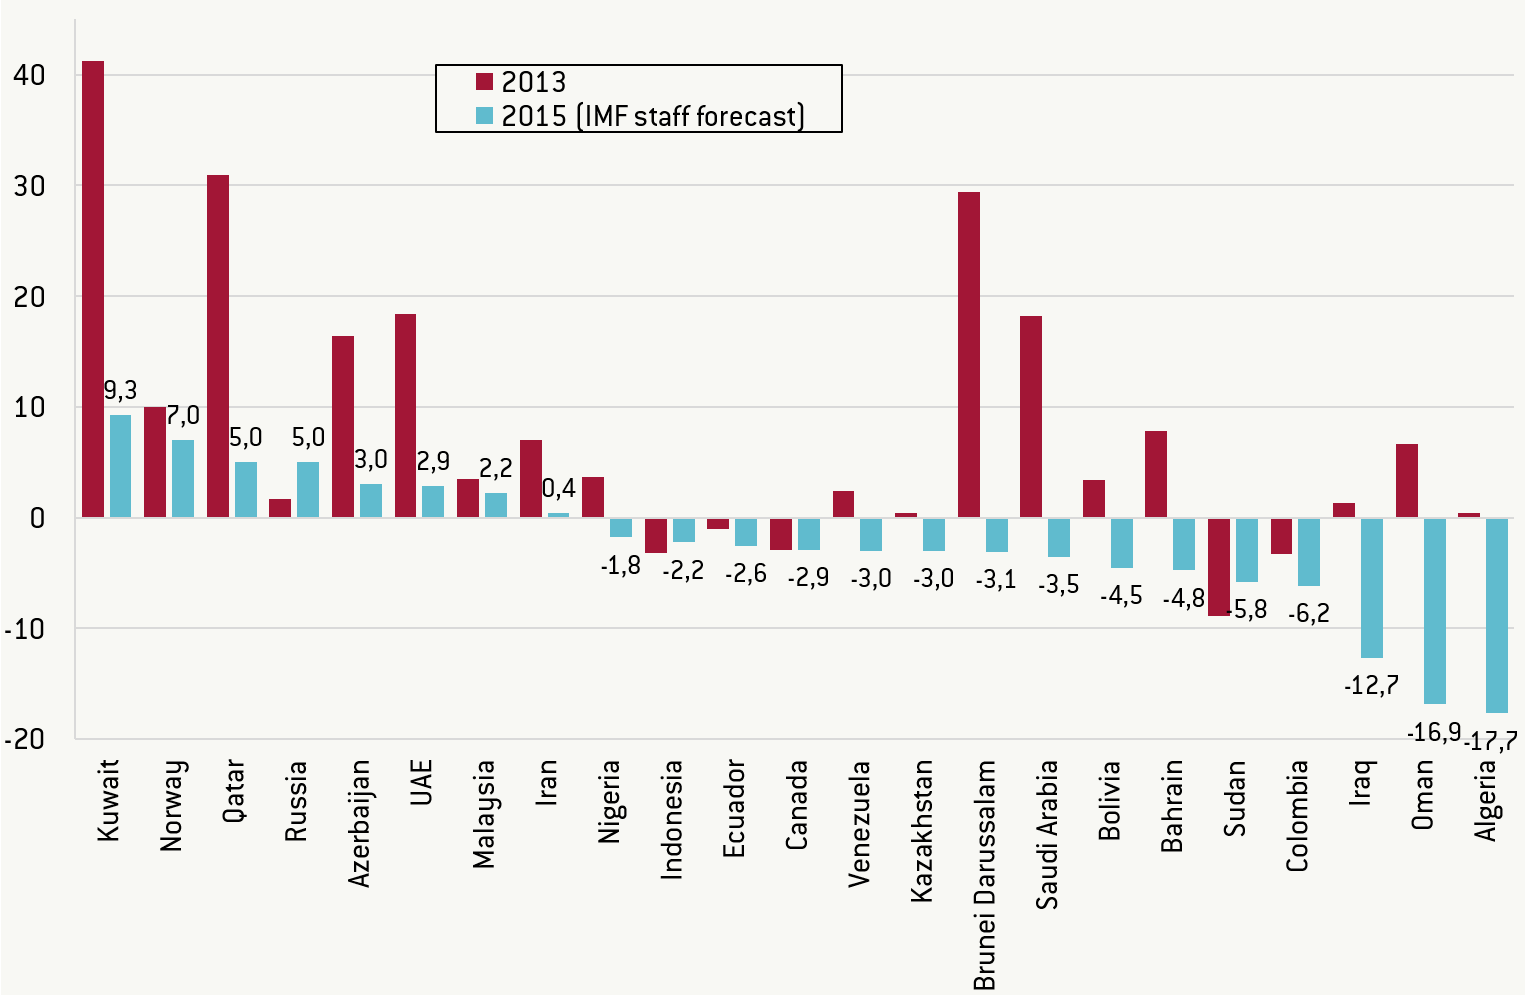
Unlike growth, the current account balance of most oil-exporting countries will deteriorate, sometimes substantially as in cases of Algeria, Azerbaijan, Brunei Darussalam, Kuwait, Oman, Qatar, Saudi Arabia and UAE (Figure 5). However, several countries will manage to either continue to run current account surpluses (Azerbaijan, Kuwait, Malaysia, Norway, Qatar, Russia and UAE) or will keep current account deficits below 4% of GDP (Brunei Darussalam, Canada, Ecuador, Indonesia, Kazakhstan, Nigeria and Saudi Arabia). This will be possible because of their high current account surpluses in the period of high oil prices.
Figure 5: Current account balance, as percent of GDP, 2013 and 2015
Source: IMF World Economic Outlook database, October 2015
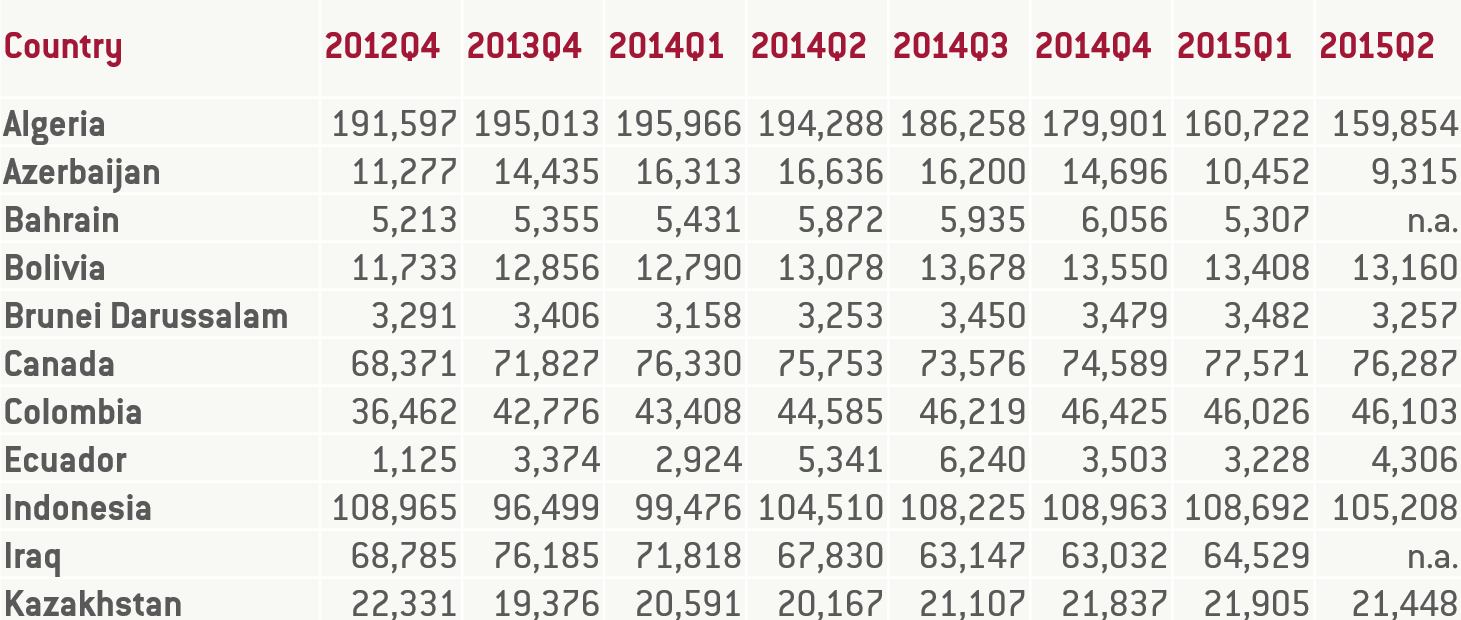
In several countries, the deterioration of the current account balance has led to a decline in the central bank’s international reserves (Table 1): these reached their highest level in mid-2014 and then started to decline. However, there are exceptions. In countries suffering from conflicts (Libya and Sudan), poor macroeconomic policy (Nigeria and Venezuela) or capital flight caused by the poor business climate (Nigeria and Russia), the trend of declining international reserves started earlier. On the other hand, Bahrain, Bolivia, Brunei Darussalam, Canada, Colombia, Indonesia, Kuwait, Norway, Oman, Qatar and UAE recorded either small or no decreases. Interestingly, the latter group is not homogeneous. It includes economies with low degrees of dependence on oil exports and oil rent (Canada, Indonesia), high oil export dependence but low shares of oil rent in GDP (Norway) and economies with high exports and GDP dependence on oil, ie most of Gulf countries (except Saudi Arabia) and Brunei Darussalam.
Table 1: International reserves (without gold), in USD millions, 2010-2015
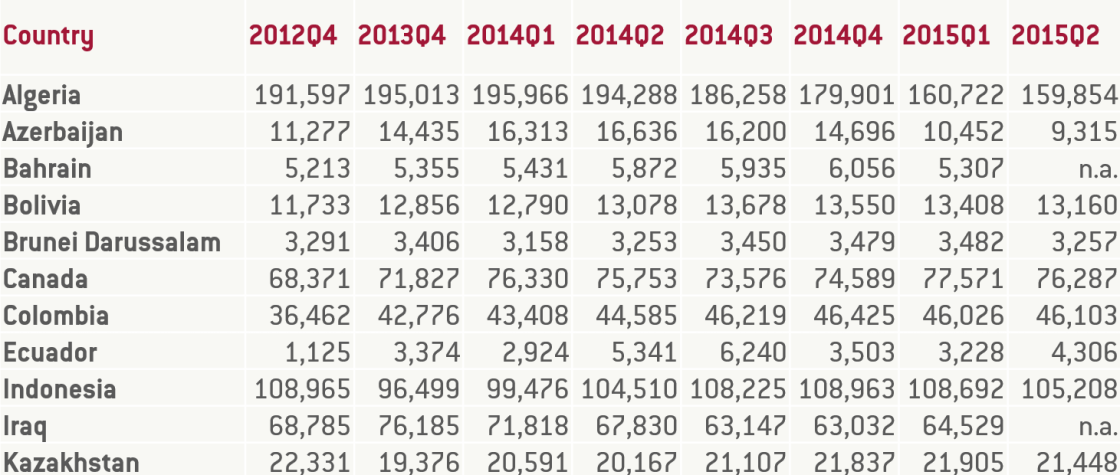
Source: IMF IFS database
Deterioration of fiscal accounts
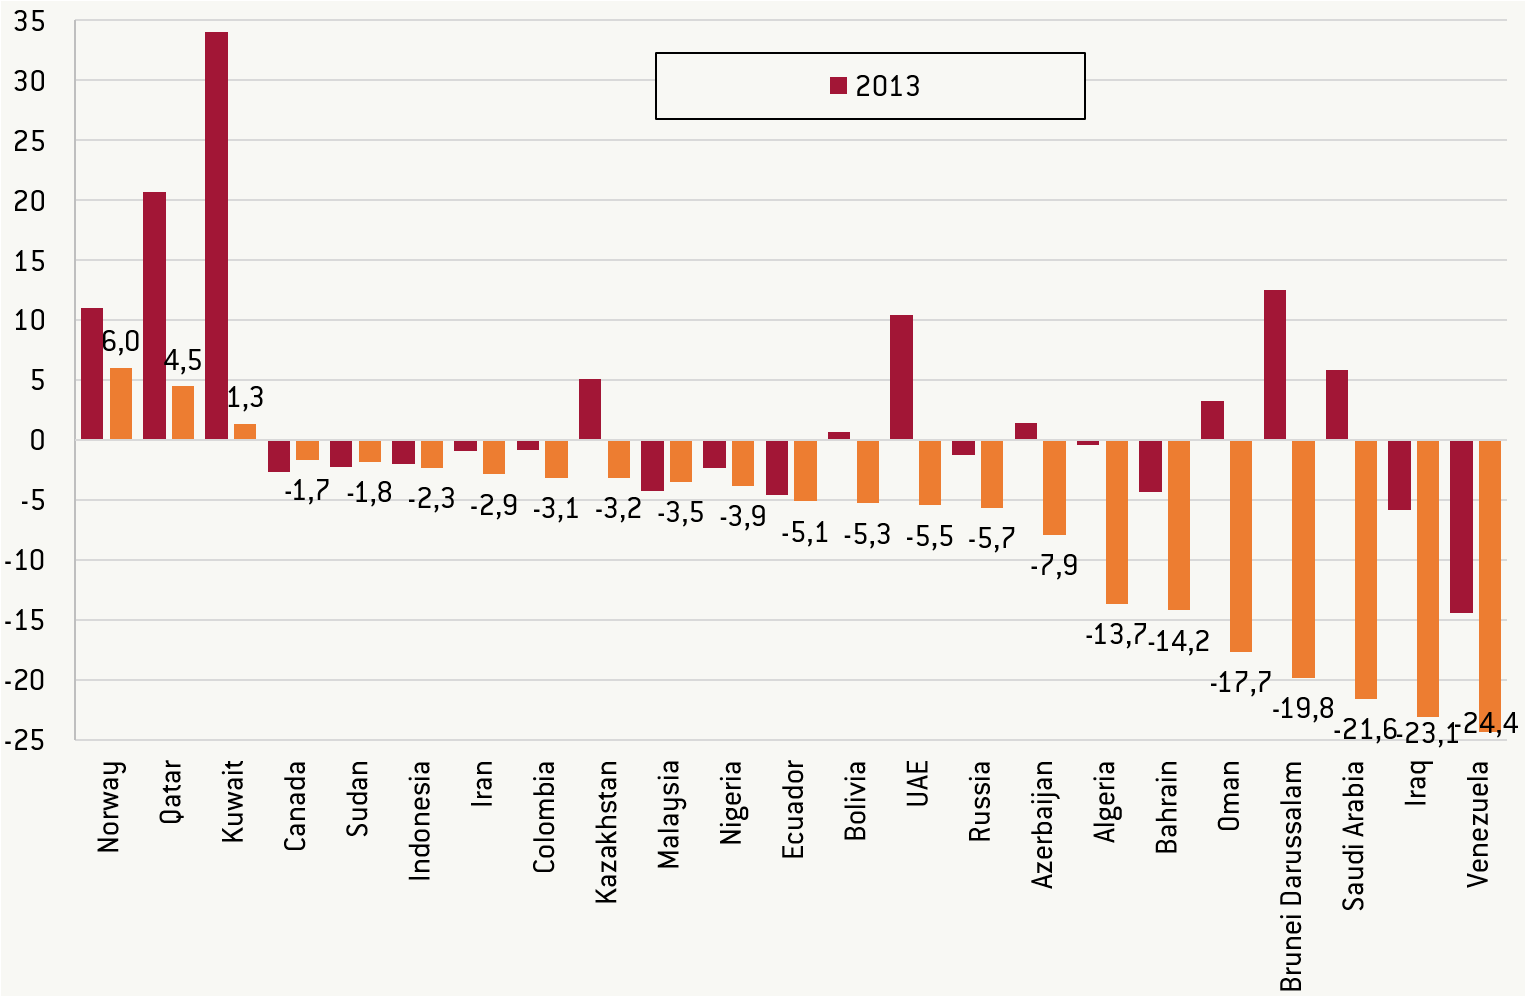
As Figure 6 shows, several countries have recorded serious deteriorations in their fiscal balances. This group includes Algeria, Azerbaijan, Bahrain, Brunei Darussalam, Kuwait, Oman, Saudi Arabia and UAE. Other countries – Bolivia, Colombia, Ecuador, Kazakhstan, Nigeria, Norway, Qatar, and Russia – record either small or moderate deteriorations of their fiscal positions. It is worth noticing that, despite deterioration, Kuwait, Norway and Qatar will continue to have positive GG balances in 2015. In Canada, Indonesia and Malaysia, fiscal deficits will not increase.
The deteriorating fiscal balances will contribute to increases in both gross (Figure 7) and net public debt (Figure 8).
While only a few countries (Bahrain, Columbia and Ecuador) will increase substantially their gross GG debt to GDP ratio by the end of 2015, most will run down their fiscal reserves accumulated in boom years.
This can be deducted from the net public debt data of Algeria, Azerbaijan, Brunei Darussalam, Libya, Russia, Saudi Arabia and other countries, or obtained by comparing their gross and net debt statistics (Figure 7 with Figure 8)[5].
Figure 6: GG net lending/borrowing, in percent of GDP, 2013 and 2015
Source: IMF World Economic Outlook database, October 2015
Figure 7: GG gross debt, in percent of GDP, 2013 and 2015
Source: IMF World Economic Outlook database, October 2015
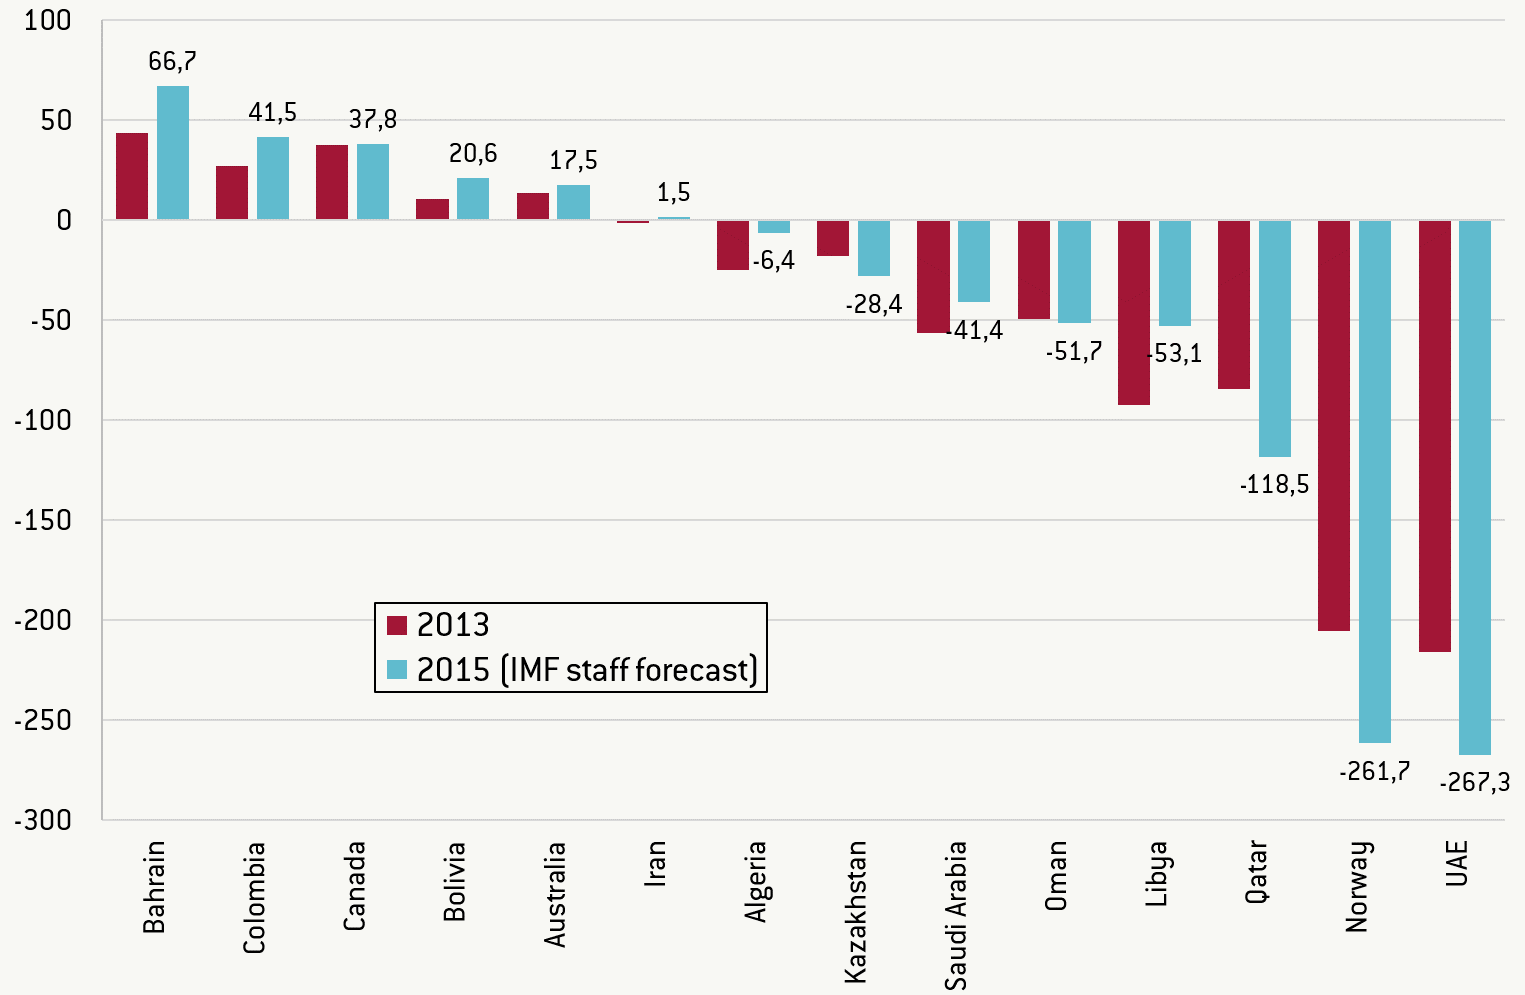
Interestingly, some countries, for example Kazakhstan, Norway, Oman, Qatar and UAE, will improve their net debt positions by the end of 2015. In some cases, this phenomenon can be partly explained by the effects of currency depreciation (see the next section). In Norway and UAE, the net public assets (the net debt with a negative sign) will exceed 250 percent of GDP. In Qatar they will exceed 100 percent of GDP at the end of 2015. The net GG debt will also remain negative in Oman, Saudi Arabia, Libya, Kazakhstan and Algeria.
Figure 8: GG net debt, in percent of GDP, 2013 and 2015

Source: IMF World Economic Outlook database, October 2015
Changes in exchange rates and inflation
As result of the oil-price shock, several oil producers were either forced or decided voluntarily to depreciate their currencies against the US dollar. To be fair, this process started before mid-2014, when oil prices were still high, and was related to the gradual tightening of US monetary policy and the resulting strengthening of the US dollar, which affected not only currencies of oil/ fuel producers but also those of other countries, including the euro and Japanese yen.
Figure 9 shows depreciation of the currencies of selected oil producers between 30 June 2014 and 30 September 2015 based on the standardised IMF exchange rate database.
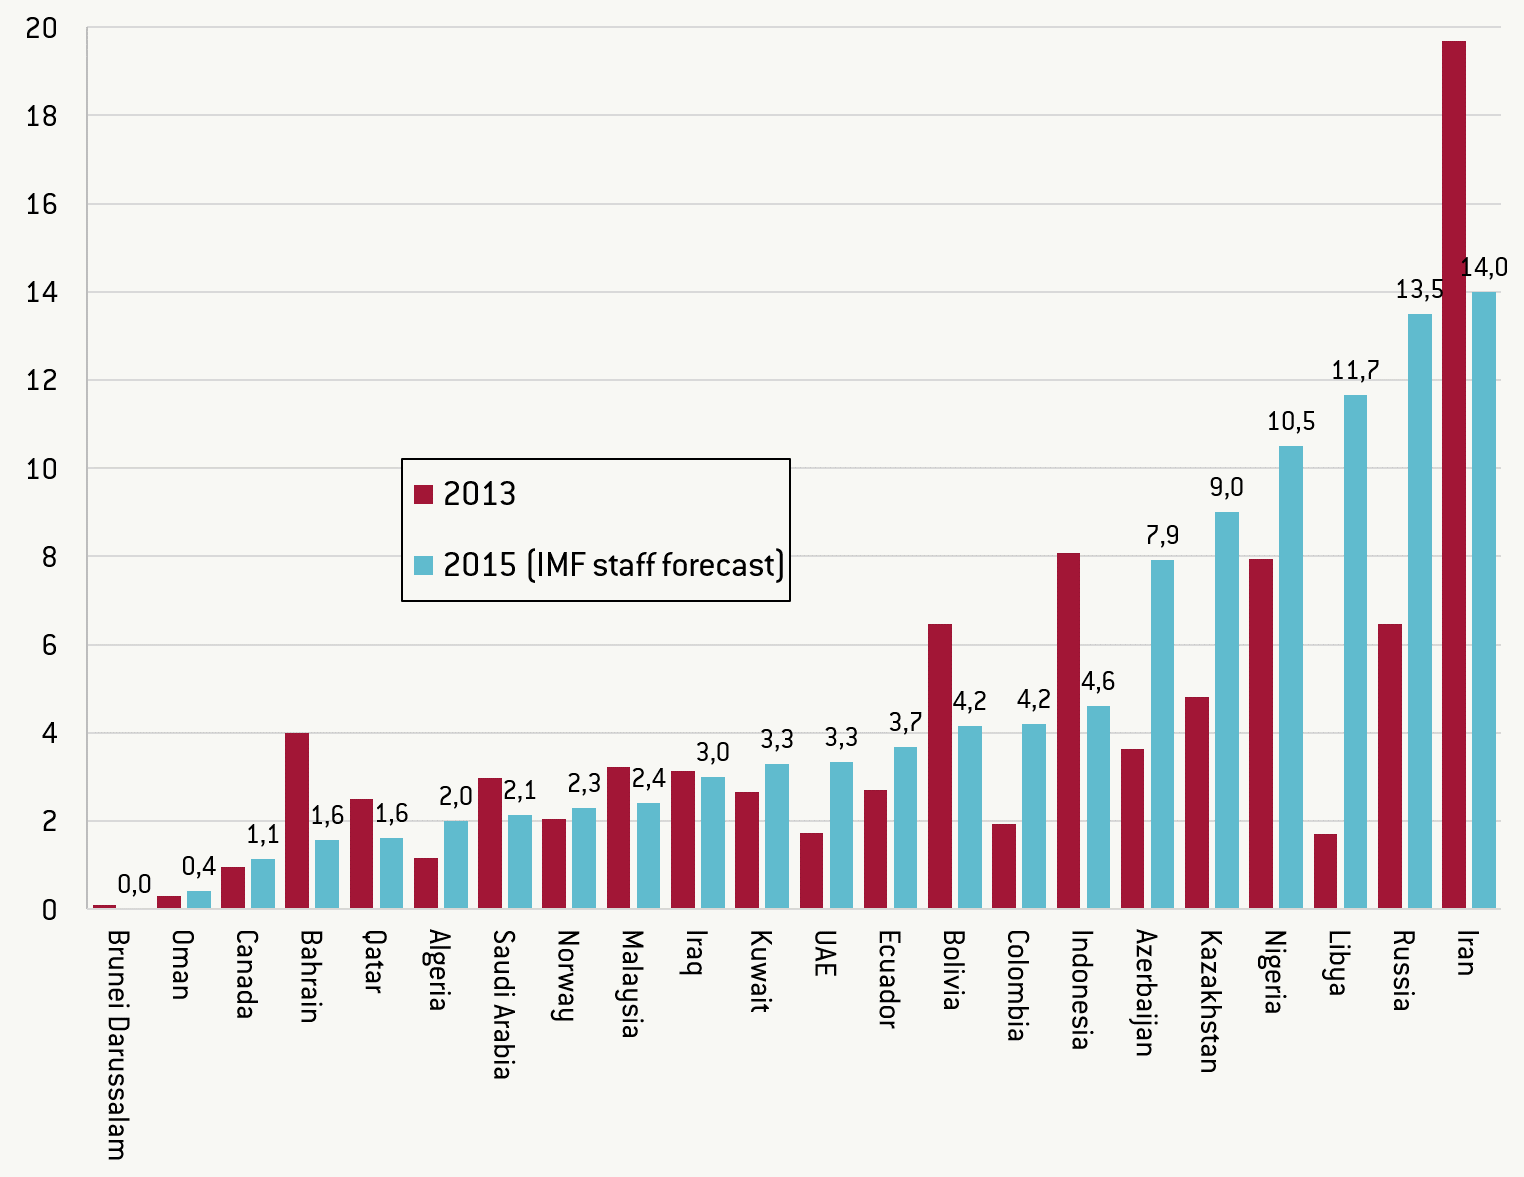
In some cases (Russia and Kazakhstan), depreciation was substantial. In Russia, depreciation happened on top of the serious balance-of-payments crisis between November 2014 and January 2015, and was triggered, not only by the oil price decline, but also by the US/EU sanctions (in response to Russia’s annexation of Crimea and its intervention in eastern Ukraine), Russia’s trade counter-sanctions against western partners, and continuous capital outflow as a consequence of the poor business and investment climate (see Dabrowski, 2015a, b). Large-scale depreciation of the ruble led to a more than doubling of Russia’s inflation rate (Figure 10).
Kazakhstan decided to abandon its soft peg to the US dollar and allow its currency to depreciate, for the first time in February 2014 (by approximately 17 percent), then since December 2014 more gradually, and finally more abruptly in August 2015, as result of the rapidly deteriorating competitive position of Kazakhstani producers relative to their Russian counterparts within the common customs area created by the Eurasian Economic Union. Neither Kazakhstan's balance of payments nor fiscal position provided a strong justification for such a policy decision.
Figure 9: Nominal depreciation of unit of national currency against US dollar between June 30, 2014 and September 30, 2015, in percent
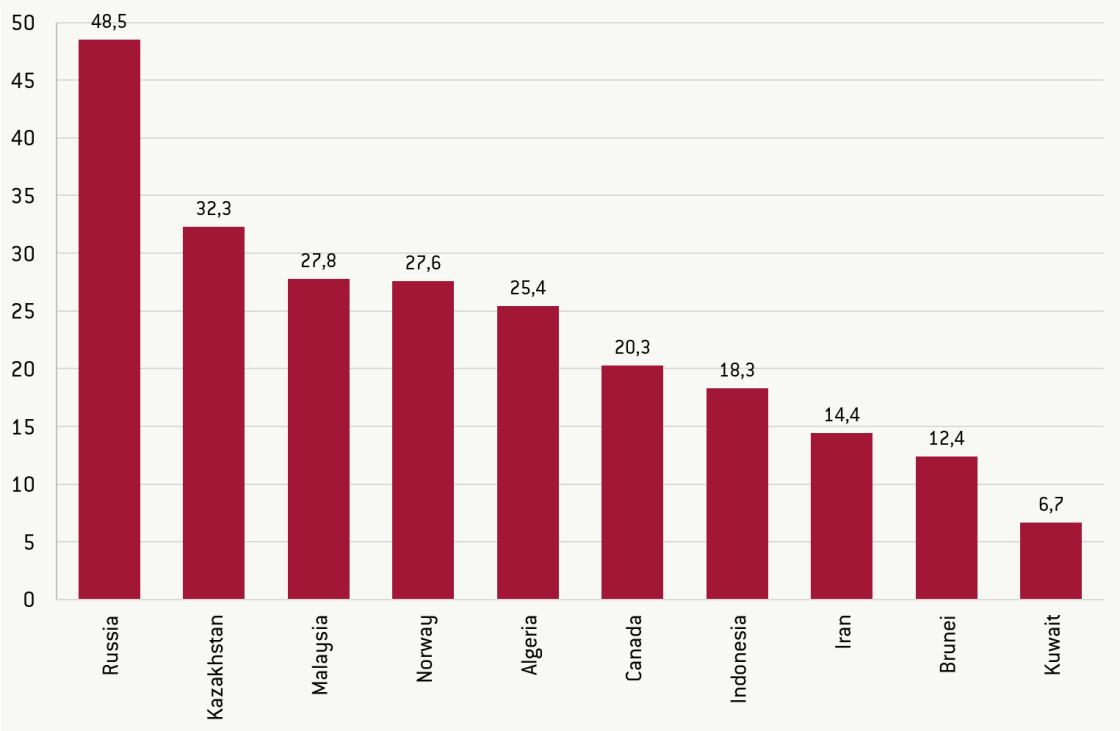
Figure 10: End-of-year inflation, in percent, 2013 and 2015

Source: IMF World Economic Outlook database, October 2015
As well as changes in the exchange rates of their currencies, both Russia and Kazakhstan declared changes in their monetary regimes – towards inflation targeting and free floating.
In inflation-targeting and free-floating Canada and Norway, currency depreciation happened in a gradual and smooth manner and was guided largely by market forces. It produced no inflationary pass-through in either economy (Figure 10). A similar smooth process of currency depreciation with no inflationary impact was observed in Indonesia and Malaysia, which have flexible exchange-rate arrangements and focus largely on inflation targets.
Several oil exporters left their currency pegs unchanged: five Gulf countries (except Kuwait, which conducted a small-scale devaluation), Brunei Darussalam, which continues its currency board arrangement with Singapore, and Ecuador, which continues using the US dollar as its national currency.
Other countries corrected their currency pegs to the US dollar. Azerbaijan devalued its manat by 33.6 percent in the period covered by Figure 9 (most of the devaluation happened in February 2015) [6]. As well as devaluing by 25.4 percent, Algeria continued restrictions on current and capital account transaction. Nigeria devalued the naira by 26.6 percent[7] and simultaneously increased the number of currency restrictions for import operations (Economist, 2015). Nigeria continues to run multiple exchange rates, similarly to Iran.
Venezuela has left the official exchange rate of its bolivar unchanged. However, its black-market rate skyrocketed because of the further deepening of its serious balance-of-payment and currency crisis, which started several years ago as result of the populist policies of the late president Hugo Chavez and his successor Nicolas Maduro. Venezuela's annual inflation is expected to increase to 190 percent at the end of 2015. In addition, the population is suffering from drastic shortages of many basic consumer goods, caused by administrative price controls.
Obviously, the degree of currency devaluation in countries that resort to current and capital account controls is hardly comparable to that in countries that do not apply such restrictions.
Summary
From our analysis, the following tentative conclusions can be drawn:
- More diversified economies (Canada, Indonesia and Malaysia) have been less affected by the oil-price shock than those that are highly dependent on hydrocarbon production and exports.
- Among countries that are highly dependent on oil production and exports, those that responded with large-scale fiscal stimulus (Gulf countries, Brunei Darussalam and Algeria) have managed to mitigate the impact of lower oil prices on GDP. However, they have had to pay a price in terms of deterioration of their fiscal positions and current-account balances. The sustainability of such a policy response in the longer term will depend on the future level of oil prices, the size of fiscal buffers and central banks’ international reserves, and the elasticity of the supply sides of individual economies.
- Overall, countries that conducted prudent macroeconomic policies and built-up large fiscal buffers in boom years (Gulf countries, Norway, Brunei Darussalam) have had more room to manoeuvre in choosing the right policy response to the price shock, compared to those that had smaller or no reserves. In particular, they could employ countercyclical fiscal policy to mitigate the effect of lower prices (see above).
- The impact of monetary regimes on macroeconomic adjustment paths is less clear. Floating exchange rate and inflation-targeting countries (Canada, Columbia, Indonesia, Malaysia and Norway) managed to adjust smoothly their exchange rates without financial-market turbulence or inflationary impact. However, these are the economies that do not represent the greatest dependence on oil production, and this exact factor (structural diversification rather than monetary regime) might play a decisive role in smooth accommodation of oil-price shocks. At the other end of the monetary-regime spectrum, countries with long-term peg commitments (Brunei Darussalam and Gulf countries except for Kuwait) also managed to avoid financial turbulence and continued to grow. Their pegs play the role of important price-stability and macroeconomic credibility anchors. There is no evidence that flexible exchange rates would better serve these particular economies.
- Countries that were forced to abandon their pegs and devalue their currencies under market pressure (such as Russia) faced the greatest challenges in terms of credibility loss, macroeconomic uncertainty, capital flight, inflation and economic contraction.
- In some instances, adverse factors other than oil-price changes have had an impact, including: economic and financial sanctions (Russia), internal unrest or armed conflict (Russia and Nigeria), the domino effect from currency devaluation by major trade partners (Kazakhstan), the declining volume of hydrocarbon production (Azerbaijan, Brunei Darussalam and Bahrain).
References
Dabrowski, M. (2015a): It’s not just Russia: Currency crisis in the Commonwealth of independent states, Bruegel Policy Contribution, Issue 2015/01, https://bruegel.org/wp-content/uploads/imported/publications/pc_2015_01…
Dabrowski, M. (2015b): The systemic roots of Russia’s recession, Bruegel Policy Contribution, Issue 2015/15, https://bruegel.org/wp-content/uploads/2015/10/pc_2015_15.pdf
Dale, S. (2015): New Economic of Oil, http://www.bp.com/content/dam/bp/pdf/speeches/2015/new-economics-of-oil-spencer-dale.pdf
Economist (2015): Defending the naira. Wheelbarrows to the rescue, The Economist, August 29, http://www.economist.com/news/finance-and-economics/21662603-nigerias-central-bank-pioneers-new-method-shore-up-local?zid=293&ah=e50f636873b42369614615ba3c16df4a
[1] See http://www.imf.org/external/pubs/ft/weo/2015/02/weodata/index.aspx
[2] The author would like to thank Uuriintuya Batsaikhan for excellent research assistance.
[3] Iran remains also affected by international trade and financial sanctions related to its nuclear programme.
[4] Their prices also declined since the beginning of 2014, so the picture of export price shock remains consistent.
[5] Unfortunately, the WEO database on net GG debt remains incomplete and does not include several oil producing countries (see Figure 8). Net GG debt for some of the missing countries (for example, Azerbaijan and Russia) can be estimated based on national statistical sources. However, for methodological reasons these estimates are not fully compatible with the WEO statistics.
[6] http://en.cbar.az/other/azn-rates
[7] http://statistics.cbn.gov.ng/cbn-onlinestats/DataBrowser.aspx
About the authors
Related content

European natural gas imports
This dataset aggregates daily data on European natural gas import flows and storage levels.

Industrial policy for economic security

The impact on the European Union of Ukraine’s potential future accession
This report evaluates the impact on the EU of a possible EU accession of Ukraine, focusing on economic consequences and institutional developments.

Ukraine’s path to European Union membership and its long-term implications
The war complicates the accession process, but Ukraine can work progressively towards meeting the entry conditions