Can Chinese growth defy gravity?
This paper discusses China’s growth for the next two decades, identifying the main challenges and factors that could mitigate its deceleration.

Executive summary
- Chinese growth, astounding since the beginning of the reform era, has slowed in the last decade. We offer a baseline estimate (based on the current trend) of China’s medium-term growth rate, which we project to fall to 2.4 percent by 2035.
- Several factors create uncertainty around this baseline. China’s rapid aging is already incorporated into our long-term growth scenario, but its impact on growth will depend on how China’s remaining urbanisation process spreads over time, how the shrinking labour supply affects labour productivity and whether the decline in total factor productivity growth, reflecting the lack of reform during the last decade and possibly the rising role of the state, can be reversed.
- Investment in China, for decades the largest factor in China’s growth, is expected to contribute less to growth given the increasingly low return on assets, particularly on state-led investment. The rapid piling up of public debt is also becoming a heavy burden for the Chinese economy. Finally, the COVID-19 pandemic may have left significant scarring effects, such as structurally high youth unemployment and low investment confidence.
- On the upside for China, the rise in human capital and research and development expenditure may support innovation and growth, but the magnitude of this effect is uncertain, because it is unclear if higher innovation will translate into higher total factor productivity, and because of the United States’s push to contain China technologically.
The author thanks participants in a Bruegel research meeting for comments on this paper, and Robin Schindowski for his very able assistance. This paper was written as part of a project, ‘Dealing with a Resurgent China’, which has received funding from the European Union’s Horizon Europe programme under grant agreement number 101061700. Views and opinions expressed are those of the author(s) only and do not necessarily reflect those of the European Union. Neither the European Union nor the granting authority can be held responsible for them.
1 Introduction
China has become a crucial supplier of traded goods to the world market and a sizable consumer market for global companies. China’s role in the global economy has increased relentlessly in the last few years, but the rate of this growth has been decelerating since 2010, although the rate remains higher than most of China’s peers. Overall, China has contributed about a quarter of global growth in the last two decades.
In this context, understanding the extent of, and the reasons behind, China’s structural deceleration is clearly important for both China and the world. This paper discusses China’s growth potential for the next two decades, identifying the main challenges and the factors that could mitigate China’s structural deceleration.
In section 2, we introduce our baseline scenario for Chinese economic growth up to 2035, the year by which China’s GDP should double compared to 2020, according to the so-called long-range objectives for 2035 that were included in China’s 14th Five-Year Plan for 2020-25 1 See https://english.www.gov.cn/w/14thfiveyearplan/. . We, then, compare China’s expected economic performance to that of other countries when their level of economic development (measured in GDP per capita terms) was similar to that of China today. Such comparison of convergence paths offers a generally favourable prognosis for China’s ability to escape the middle-income trap. However, estimating long-term growth based on convergence theory is just a baseline. Outcomes can be very different depending on how other factors evolve.
In the second part of this paper, we look into the key factors explaining potential growth based on growth accounting, and assess whether they are likely to push China’s potential growth down or up. Factors weighing on growth will include an aging population, over-investment which has pushed down the return on assets, the piling up of debt, and potential COVID-19-related scarring. On the positive side is China’s massive bet on innovation. Finally, we offer an overview of how much innovation may already be mitigating China’s structural deceleration in terms of the evolution of total factor productivity.
2 China's growth story: a recap
Over the last two decades, China’s economic growth has been close to miraculous compared to the rest of the world, especially given China’s huge population. Figures 1 and 2 show the distribution of 10-year average GDP per capita growth rates for countries reaching per-capita incomes of $1,000 and $5,000 after 1960. Countries in the ninetieth percentile of the distribution achieved annualised growth rates of 7.1 percent and 4.4 percent in the 10 years after crossing the $1000 and $5000 per capita income thresholds, respectively. China was in the highest percentile, achieving 9.9 percent and 6.3 percent, respectively.
Figure 1: Chinese growth in a global context (post $1000 GDP per capita)
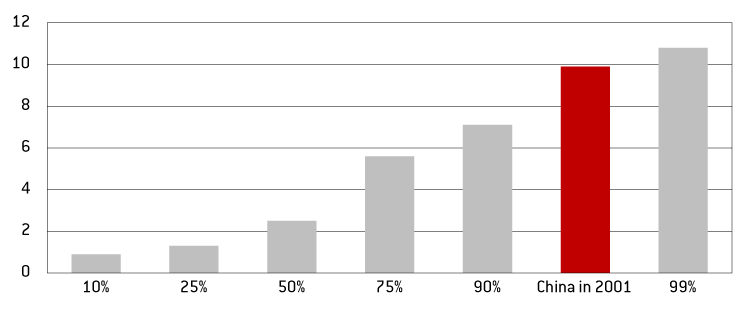
Source: Bruegel based on Natixis, World Bank WDI. Note: Average real GDP per capita growth rate for the 10 years after an economy reaches $1000 per capita (ranked by percentile, based on world GDP from 1960 to 2020).
Figure 2: Chinese growth in a global context (post $5000 GDP per capita)
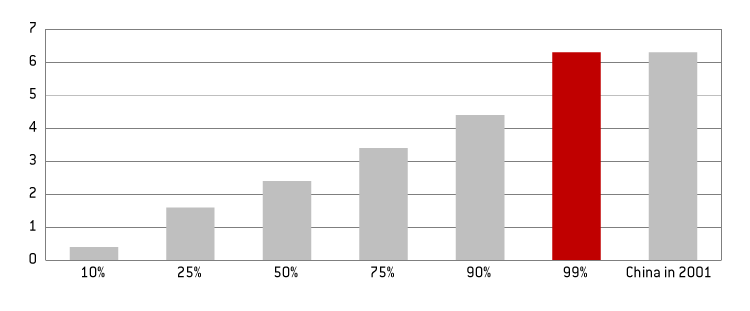
Source: Bruegel based on Natixis, World Bank WDI. Note: Average real GDP per capita growth rate for the 10 years after an economy reaches $5000 per capita (ranked by percentile, based on world GDP from 1960 to 2020).
In 2019, China crossed the $10,000 per-capita income threshold. COVID-19 hit China hard with a growth rate of only 2.2 percent in 2020, but the economy rebounded to 8.1 percent in 2021 thanks to the containment of the virus with harsh restrictive measures. However, the Omicron variety of the virus, with much more rapid transmission, reached China in early 2022. China’s decision to continue to apply zero-COVID-19 policies resulted a rather low GDP growth rate of barely 3 percent in 2022. For 2023, the official growth target is 5%, in the context of the reopening of the economy. The question now is what will China’s growth rate be beyond 2023.
3 Will the Chinese economy stay on the same convergence path as in the past?
To gauge China’s potential growth rate, we use Solow’s convergence theory, which is based on the assumption that poorer countries grow relatively faster than richer countries and that growth rates will converge in the long run (Solow, 1956). Many studies make use of this framework, and many have pointed to a slowing growth trajectory for China. For example, the World Bank (2019) expected China’s average annual growth rate to decline to 4 percent from 2021 to 2030 in a scenario of continued limited reform. The World Bank considered different growth projections based on different assumptions about China’s future economic reforms to deal with the economic bottlenecks. Similarly, Albert et al (2015) suggested that China will continue its deceleration path over the next decade, but will remain at a growth rate above 4 percent in 2030. However, some economists think that China can defy growth-rate ‘gravity’ by continuing to grow very rapidly. For example, Bai and Zhang (2017) estimated that China’s growth rate will be about 4.8 percent between 2026 and 2030. Yifu and Wang (2021) argued that “China still has the potential to continue growing at over 8% per annum at least the next decade”.
For our predictions of Chinese growth up to 2035, we follow the methodology in Gordon (2014) and implement a convergence-style estimation for labour productivity based on estimates of convergence of labour productivity growth and labour supply from United Nations’ population forecasts (Table 1). We rely on the pre-pandemic data for our extrapolation since it is too early to know whether pandemic-related impacts on labour productivity are here to stay. We find that China’s average growth rate should stand at 4.9 percent from 2021 to 2025, and at 3.6 percent from 2026 to 2030 (Figure 3 and technical details in the appendix).
Figure 3: China, GDP per capita growth projection
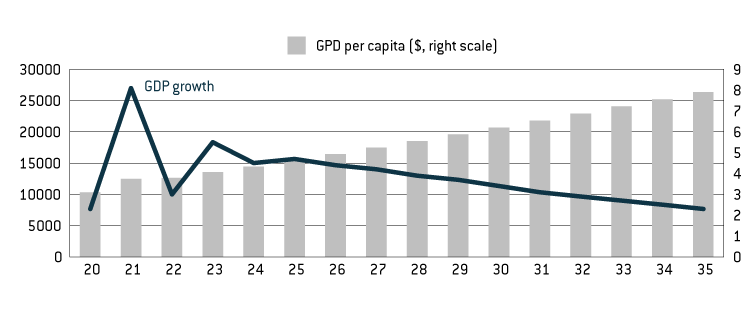
Source: Bruegel based on Natixis, World Bank WDI.
Table 1: Forecasting China’s potential GDP growth rate (%) based on the convergence model
|
Output |
Labour productivity |
Employment rate |
Labour participation rate |
Adult population growth rate |
|
|
2021-2025 |
4.9 |
4.9 |
-0.1 |
-0.3 |
0.4 |
|
2026-2030 |
3.6 |
3.8 |
-0.1 |
-0.5 |
0.4 |
|
2030-2035 |
2.4 |
3 |
-0.1 |
-0.7 |
0.2 |
Source: Bruegel.
Figure 4: Average growth rates in the 10 years after crossing the $10,000 GDP per capita threshold
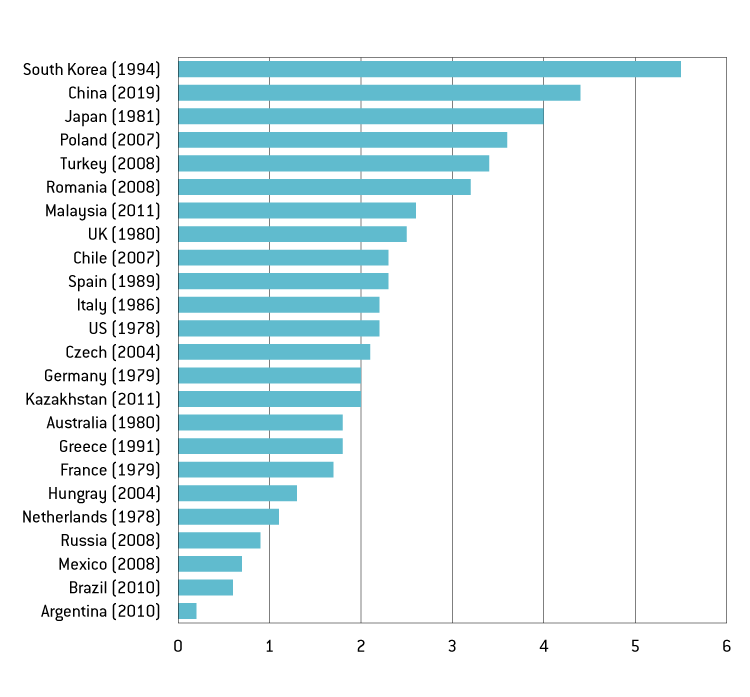
Source: United Nations. Note: dates in brackets show the year of crossing the threshold.
As a way to offer a comparative judgement on the speed of China’s deceleration, Figure 4 compares our baseline average growth rate for China in the 10 years after reaching an income level of $10,000 per capita to the average growth rates of other countries in the 10 years after they reached the same GDP per capita threshold. Only two countries were able to continue growing at a rate of at least 4 percent after surpassing $10,000 per capita: South Korea, with 5.5 percent average GDP growth from 1994 to 2004, and Japan with 4 percent average GDP growth during the 1980s. The average growth rates of all other countries in the ten years after they surpassed $10,000 per capita was much lower, with Poland (3.6 percent) closest to Japan’s rate. Against such a backdrop, as South Korea, Japan and Poland have escaped the middle income trap, it is to be expected that China will do the same. In fact, based on the reasonable growth rate estimates, China should reach $20,000 per capita in 2030 (ten years after it reached $10,000 per capita).
The above long-term forecasts of China’s GDP growth rate and estimates of its GDP deflator can be used to gauge whether China’s GDP will surpass that of the United States in the foreseeable future. The results show that China’s economy will amount to about 200 trillion renminbi (in current prices) in 2035, which approximately doubles the current level. Using the average exchange rate of the past few years (6.5 renminbi to the dollar) 200 trillion renminbi will translate into $30.1 trillion. Because the US economy was $23 trillion in 2021, and is already at the frontier of the global economy, we assume an average 2 percent real growth rate for the next 15 years for the US, bringing US GDP to about $30 trillion in 2035. Based on these assumptions, Chinese GDP would converge with that of the US in the next 15 years, but would not surpass it substantially. From 2035, growth rates for China and the US will be similar, meaning that neither of the two economies would significantly overtake the other.
4 Structural factors affecting China’s long-term growth
Moving beyond convergence theory and reflecting on the main factors behind potential growth in a growth accounting framework, several structural factors need to be analysed. While not aiming at estimating the downward or upward bias of each of these factors, we assess the direction of the bias in order to conclude whether the risks to China’s long-term growth are mostly on the downside or the upside.
4.1 Population aging
One of most widely discussed supporting factors for Chinese growth in the past was the ‘population dividend’. At the beginning of the Reform and Opening-up era in the 1980s, China experienced a surge in the working-age population relative to the total population (Figures 4 and 5). This kept labour costs in China low for a long period, which helped China remain competitive for a long period. The main reason for this was the steady increase in urbanisation, moving people from the low-productivity agriculture sector to the higher-productivity manufacturing sector in the cities.
Now, China’s population is aging, with the birth rate declining even further since 2017. Interestingly though, aging will hardly be a factor in explaining growth deceleration up to 2035 thanks to the remaining scope for urbanisation in China. From 2035 onwards, aging will contribute much more intensively to further deceleration of China’s growth rate, as urbanisation will have been completed and because the recent further decrease in the birth rate which started in 2017 will start to bite. From 2035 onwards, aging should cut 1 percentage point annually from the growth rate (see García-Herrero and Xu, 2023, for further details).
Figure 5: Chinese population by broad age group
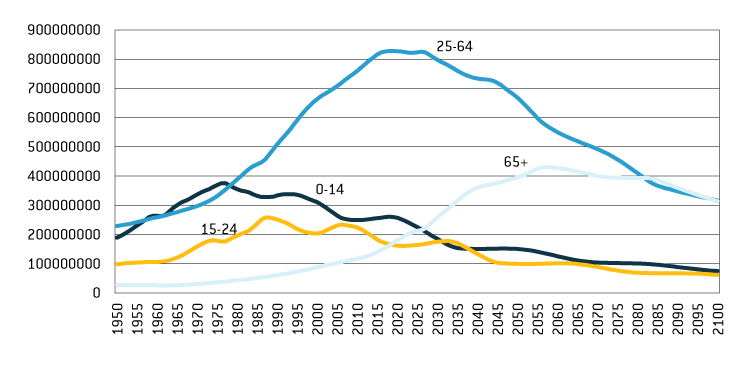
Source: United Nations.
Figure 6: Forecast impact of aging on China’s GDP growth rate
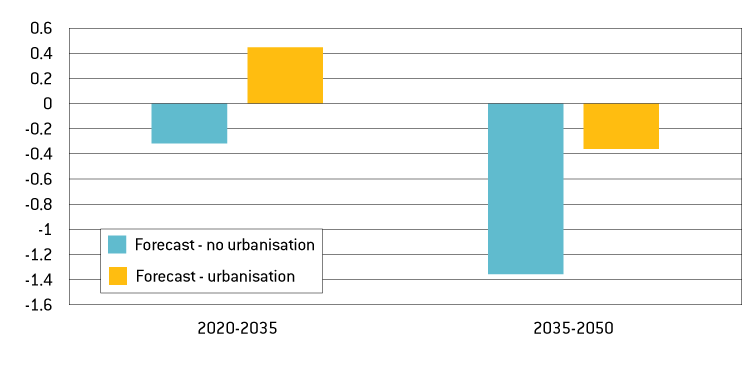
Source: United Nations. Note: only labour supply is considered; no change in labour productivity is assumed.
The Chinese government has started to take bolder measures to mitigate the decline in the fertility rate and its impact on China's labour supply, including a potential increase in the retirement age and continuing promotion of urbanisation. Finally, a key question, which remains open, is how aging will impact productivity, especially labour productivity. China has a number of options to try to lift productivity, most of which focus on lifting the fertility rate, but there is also the potential to move to more capital-intensive fixed-asset investment, in artificial intelligence and automation, for example, while pushing for further human capital upgrading. In sum, population aging presents considerable challenges for China's economy, especially from 2035. However, there may be a window of opportunity stemming from fertility policies and capital-intensive investment (Figure 6).
4.2 Decreasing returns to investment
In line with the convergence theory, capital accumulation has also been a key element in China’s growth story, but its contribution to GDP has diminished in the last decade. Figure 7 shows that the investment contribution to China’s GDP, along with other factors, has been trending downward significantly for the past decade. At the same time, China has one of the world’s highest investment-to-GDP ratios (more than 40 percent), nearly double that of the US or the UK (Figure 8). This seems to indicate that the room for China to grow further based on investment acceleration may be limited. Furthermore, China’s high level of investment clearly points to overinvestment. The return on assets continues to fall, especially for state-led investment according to our calculation of the return on assets of state-owned enterprises (SOEs) versus privately-owned enterprises (POEs) (Figure 9).
Figure 7: Gross capital formation contribution to GDP growth (%)
Source: Bruegel based on Natixis, NBS.
Figure 8: Investment as a % of GDP
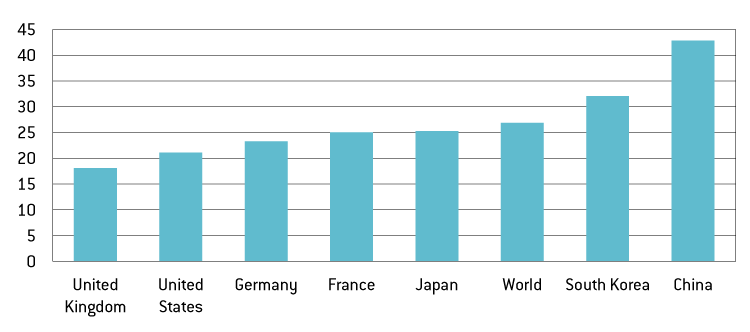
Source: World Bank WDI.
Figure 9: Chinese corporations, average return on assets (%)
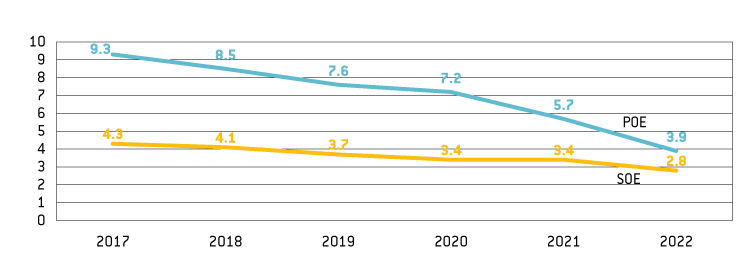
Source: Bruegel based on Natixis, Wind. Note: Calculations are based on bond-issuing companies using WIND's BDE and BSC functions. The average return on assets is defined as the simple average of the ratio of gross return over total assets for all sampled SOEs and POEs (excluding financial companies and local government financing vehicles).
4.3 Fast-growing public debt
The rapid pile-up of China’s debt, especially in the public sector since the pandemic, has raised concerns about China’s debt sustainability and the impact of debt on potential growth. China’s public debt has grown particularly fast because of borrowing by local government financial vehicles (LGFVs), which now amounts to double the combined debts of the central government and official direct borrowing by local governments. China’s total public debt has reached 97 percent of GDP (Figure 10), which stands out for a country of China’s income per capita, especially because data constraints mean the debt of SOEs is not included in this calculation.
It should be noted that the piling up of public debt does not need to harm potential growth as it depends on how the many is spent. Given that LGFVs finance most of the investment carried out by local government, one could imagine that their return on assets should be higher than for other public debt. However, the average return of LGFV projects has declined to a very low level and is decreasing, especially in the context of China’s average interest rates in the last few years. The average rate of return on assets of the LGFVs was 1.8 percent in 2017 but dropped to 1.3 percent in 2022 (Figure 11). This is a clear sign of the low efficiency of public investment, at least at local level.
Figure 10: China, outstanding government debt (% GDP)
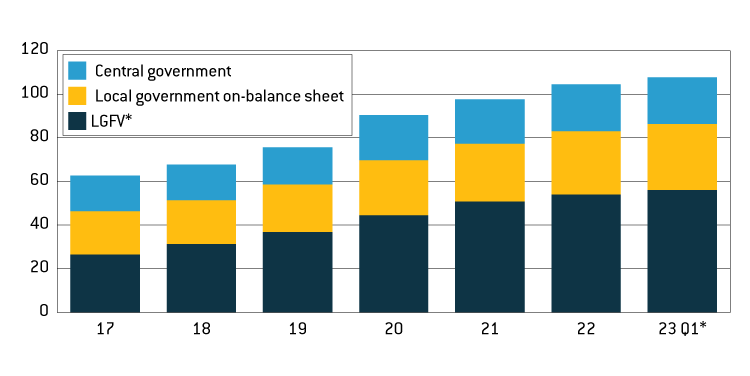
Source: Bruegel based on Natixis, China Ministry of Finance, China National Bureau of Statistics, CEIC, Wind. Note: 2023 Q1 central government outstanding debt is estimated. * LGFV = local government financing vehicle.
Figure 11: Chinese local government financing vehicles, average return on assets (%)
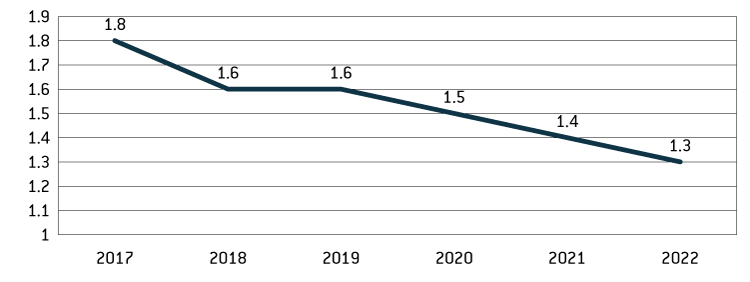
Source: Bruegel based on Natixis, Wind. Note: Calculations are based on bond-issuing companies using Wind’s BDE and BSC functions. The average return on assets is defined as the simple average of the ratio of gross return over total assets for all the sampled local government financing vehicles.
4.4 Scarring effects from the COVID-19 pandemic
An increasing number of studies is investigating the pandemic’s scarring effects or, in other words, its long-term consequences and how these might affect growth. This phenomenon is visible when individuals are ‘scarred’ by the negative experience of short-term unemployment to the extent that they become indifferent to the prospects of employment (Clark et al, 2001). This leads eventually to a permanent reduction in the labour-force participation rate and potential output. Knabe and Rätzel (2009) suggested that this negative effect on wellbeing stems largely from the fear of future unemployment. Low job security for the employed and unfavourable re-employment opportunities for the unemployed are harmful to subjective wellbeing. Kozlowski et al (2020) used the word ‘scarring’ in a rather macroeconomic context. Scarring is a persistent change in beliefs about the probability of an extreme, negative event.
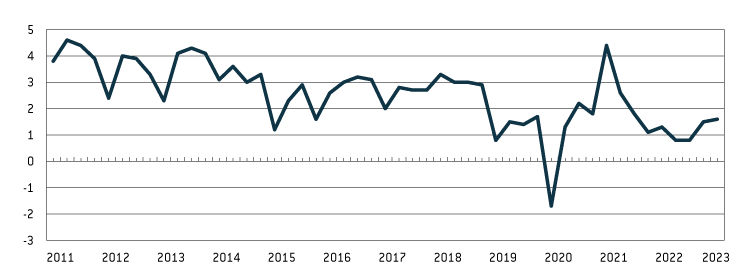
There has been much less of a systematic discussion of the scarring effect of COVID-19 on the Chinese economy. But as China has been implementing COVID-19 restrictions for longer than the rest of the world, the expected scarring effect could possibly be stronger than elsewhere. Some signals are already visible. The unemployment rate for the youngest cohort (16-24 years), increased to a record 20 percent in June 2022 (Figure 12), and even higher as recently as April 2023. This has been accompanied by a considerable increase in the demand for civil service jobs in 2022 (Figure 13) compared to jobs in the private sector. This can be read as a sign of increased uncertainty, indicating the search for security among younger Chinese cohorts. The scarring from the COVID-19 pandemic may also have a negative impact on business confidence and, with it, investment. Both effects could eventually add to the downward pressure on the economy.
Figure 12: Unemployment in China (%)
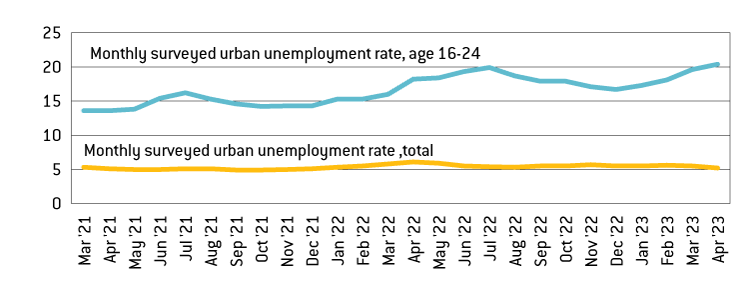
Source: National Bureau of Statistics of China.
Figure 13: Rise in the demand for civil service jobs
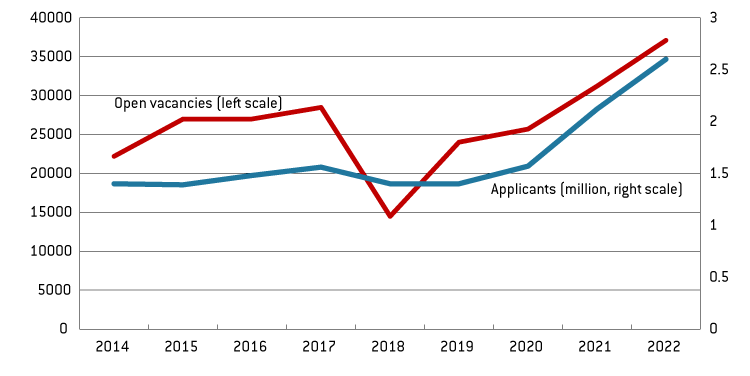
Source: South China Morning Post.
The scarring from the COVID-19 pandemic may also have a negative impact on business confidence and, with it, investment. Uncertainty in the geopolitical environment will only fuel this trend.
4.5 Geopolitical uncertainties
In contrast to the last two decades, China faces a more volatile and in many aspects less favourable geopolitical environment. Trade tensions between the US and China started with the Trump Administration in early 2018, but soon moved into technological containment, which has continued and has even been strengthened further under the Biden Administration. Figure 14 shows that China has become the biggest target for harmful intervention measures. Most have been targeted at trade in goods with China (Figure 15). Since the outbreak of the pandemic in 2020, events have moved even quicker.
Figure 14: Number of harmful interventions, cumulative until 2020
Source: Global Trade Alert.
Figure 15: Number of harmful interventions against China, cases per year
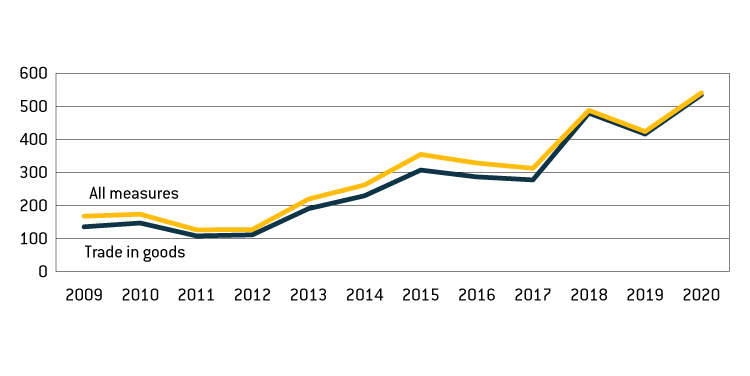
Source: Global Trade Alert.
In the context of supply shortages during pandemic lockdowns, and with European countries losing their gas supplies from Russia since the invasion of Ukraine, both the EU and US are reassessing their economic dependencies. Significant future technologies, including permanent magnets used in wind turbines and electric-vehicle batteries, rely on raw materials sourced from and processed predominantly in China. The geopolitical risks related to this were demonstrated in 2010 when China imposed an export ban on several raw materials used in hybrid cars, wind turbines and guided missiles, as part of a maritime dispute with Japan. More recently, the Chinese leadership has also considered similar bans on exports to the US 2 Sun Yu and Demetri Sevastopulo, ‘China targets rare earth export curbs to hobble US defence industry’, Financial Times, 16 February 2021, https://www.ft.com/content/d3ed83f4-19bc-4d16-b510-415749c032c1. . Excessive dependencies have also been visible in clean technology manufacturing, in which China dominates wind, EV batteries and solar panels. Both the US Inflation Reduction Act and the EU’s proposed Critical Raw Materials Act are targeted at home-shoring some of the production and reducing these dependencies (Le Mouel and Poitiers, 2023).
The United States has implemented a comprehensive set of policies aimed at restricting the access of Chinese firms to critical technologies, most prominently semiconductors. The most important escalation happened in October 2022, with the implementation of export controls on semiconductor manufacturing equipment to China. This was reinforced by a trilateral agreement on export restrictions between the US, Japan and the Netherlands, the latter two being home to firms providing crucial equipment for advanced chip manufacturing. This multilateral alliance was formalised in May 2023 with the establishment of the G7 initiated Cooperation Platform on Economic Coercion.
These developments have led to a situation in which the world is gravitating towards two independent technology ecosystems, one centred on the US and the other centred on China. Both powers are attempting to build the largest possible cohesive bloc, a process that will lead to increased technological bifurcation. The West's attempts to diversify and imposition of export controls will make it harder for China to access critical technologies, while reducing the geopolitical leverage it has over Western economies. So far, China has been unable to replicate the chip ecosystem domestically, despite decisive financial efforts.
4.6 Innovation as the chance to prevent a slowdown
Our baseline forecast (section 3) relies on a linear projection of productivity convergence based on past experience. However, modern growth theory argues that productivity growth is endogenous, and depends on the endowment of human capital and research efforts to push up total factor productivity (TFP). TFP has for a long time been a key engine for China’s growth (Figure 16) but its growth rate has dropped significantly since the global financial crisis, even more than global productivity. Whether China’s innovation efforts are providing enough tailwind to mitigate the structural deceleration of the economy will be the crucial question for the medium-term future.
Figure 16: Growth in total factor productivity (%)
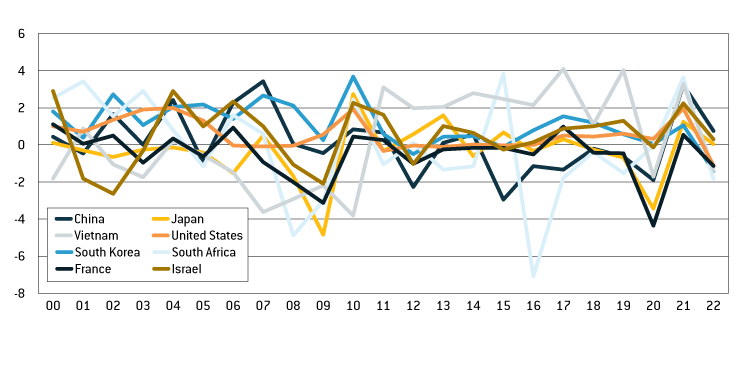
Source: Bruegel.
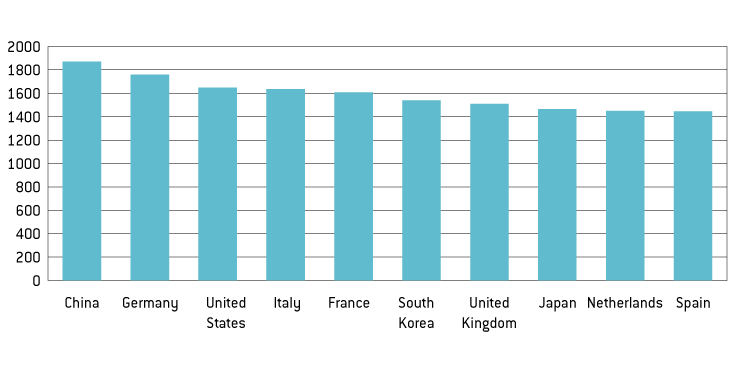
China’s leadership knows this and has made innovation policy its top priority. Under different slogans, whether ‘Made in China 2025’ or the party’s ‘Innovation-driven development’, reaching and expanding the technology frontier in major industries has become the goal of economic policy. In an overview of China’s progress on innovation and its impact on growth, García-Herrero and Schindowski (2023) found that China’s performance in terms of increasing the inputs to innovation, R&D and educational attainment is clearly favourable and so are the intermediate outcomes, such as the number of patents and scientific publications (Figures 17 and 18).
Figure 17: USPTO total patent grants (PCT and direct), selected countries
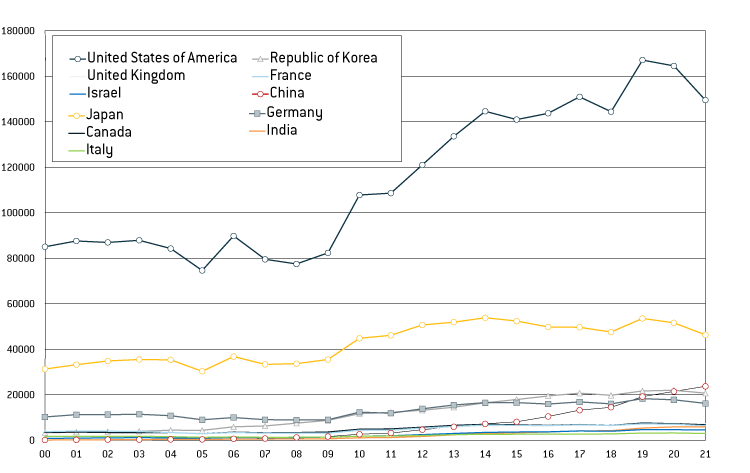
Source: WIPO. Note: USPTO = United States Patent and Trademark Office; PCT = Patent Cooperation Treaty.
Figure 18: Articles published in scientific and technical journals, by country of institution of author
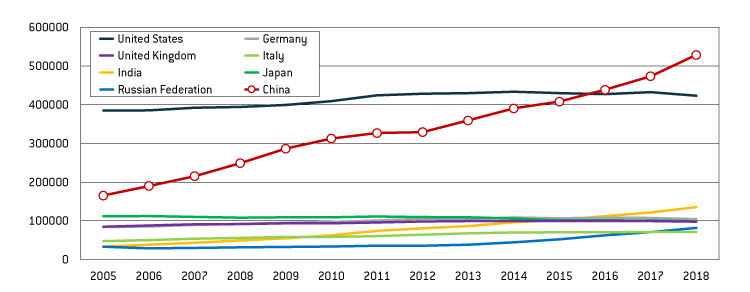
Source: World Bank, National Science Foundation. Note: Articles are classified by year of publication and assigned to country on the basis of institutional address(es) listed on the article. Articles can count for more than one country depending on the affiliations of the authors.
However, providing resources is a necessary but not sufficient condition for boosting productivity. Making best use of the factors such as human capital and R&D inputs requires efficient allocation of resources to the best productivity-enhancing firms. For example, Brandt et al (2020) showed that barriers to market entry and exit and the channelling of resources towards less-productive firms and sectors, contributed to a slowdown in manufacturing TFP growth from 2008 to 2013.
In this respect, China faces several obstacles, many of which are connected to the uncertainty factors discussed above. First, local business dynamism is stifled by excessive involvement of the government in the economy. Subsidies and venture capital funds are allocated selectively, often to politically connected firms. Local governments still rely on off-balance funds, including revenue from fines and land-transfer fees, to fill budgetary gaps. Second, the US CHIPS and Science Act 3 See https://www.whitehouse.gov/briefing-room/statements-releases/2022/08/09…. and subsequent enforcement measures have stripped Chinese innovators of their most important enabling technology, which is slowing China’s progress in important areas, including AI and quantum computing. While Chinese firms might be able to source semiconductors from third parties, they do so under increasing risk of being added to the US Department of Commerce’s entity list, which includes foreign entities subject to US license requirements for the export or transfer of specific items. Third, youth unemployment and the COVID-19 pandemic could generate widespread discouragement among China’s young people, all of whom are potential innovators.
5 Conclusions
China’s growth has been a success story for decades in terms of its economic growth. However, the deceleration that has taken place since 2012 is likely to continue, for reasons beyond the cyclical factors related to COVID-19 restrictions. Based on convergence theory (poorer countries tend to enjoy higher growth rates than the richer countries), China’s growth rate should continue to slow to 2.4 percent by 2035. Notwithstanding such deceleration, China should be able to escape the middle-income trap as its income per capita should exceed $20,000 by a large margin. It seems unlikely, however, that China will surpass the US in terms of the size of its GDP in dollar terms. China should equal the US size by 2035, but will stop converging thereafter. This means that both economies would be about the same size from 2035.
Against this backdrop, a number of uncertain factors could affect Chinese potential growth. Much attention has been paid to China’s aging, but our calculations show that its impact on growth will be limited until 2035, partially thanks to continued urbanisation. A second drag could be the increasingly low return on assets, which seems difficult to reverse. This is especially true for the public sector, which continues to pile up debt. Finally, the scarring effects from COVID-19 are not included in our growth estimates, but have the potential to weigh further on growth.
There is hope that innovation can lift total factor productivity, but there is not yet supporting evidence for this, notwithstanding massive Chinese investment in innovation, as shown by the rapid increase in R&D and higher educational attainment. A more meaningful step would be for China to reduce its apparent misallocation of innovation resources by levelling the playing field for firms of all ownership types. Beyond the misallocation of resources, US-China strategic competition and the US technological containment strategy is another worrying sign for China, potentially hobbling its attempts to mitigate structural deceleration through higher TFP stemming from innovation.
Albert, M., C. Jude and C. Rebillard (2015) ‘The Long Landing Scenario: Rebalancing from Overinvestment and Excessive Credit Growth. Implications for Potential Growth in China’, Working Paper Series no. 572, Banque de France
Bai, C. and Q. Zhang (2017) A Research on China’s Economic Growth Potential, Routledge
Brandt, L., J. Litwack, E. Mileva, L. Wang, Y. Zhang and L. Zhao (2020) ‘China’s Productivity Slowdown and Future Growth Potential’, Policy Research Working Paper No. 9298, World Bank Group
Clark, A., Y. Georgellis and P. Sanfey (2001) ‘Scarring: The Psychological Impact of Past Unemployment’, Economica 68(270): 221-241
García-Herrero, A. and R. Schindowski (2023) ‘China’s quest for innovation: progress and bottlenecks’, Working Paper 08/2023, Bruegel.
García-Herrero, A. and J. Xu (2023) ‘Aging in China: to what extent can urbanisation mitigate its negative impact?’ forthcoming, Bruegel.
Gordon, R.J. (2014) ‘A New Method of Estimating Potential Real GDP Growth: Implications for the Labor Market and the Debt/GDP ratio’, NBER Working Paper No. 20423, National Bureau of Economic Research
Knabe, A. and S. Rätzel (2009) ‘Scarring or Scaring? The Psychological Impact of Past Unemployment and Future Unemployment Risk’, Economica, 78(310): 283-293
Kozlowski, J., L. Veldkampa and V. Venkateswaran (2020) ‘Scarring Body and Mind: The Long-Term Belief-Scarring Effects of Covid-19’, NBER Working Paper, No. 27439, National Bureau of Economic Research
Le Mouel, M. and N. Poitiers (2023) 'Why Europe’s critical raw materials strategy has to be international', Analysis, 5 April, Bruegel
Solow, R.M. (1956) ‘A contribution to the theory of economic growth’, Quarterly Journal of Economics, 70 (1): 65–94
Yifu, L.J. and X. Wang (2021) ‘Dual Circulation: a New Structural Economics View of Development’, Journal of Chinese Economic and Business Studies 20(4)
We can decompose China’s GDP into the following components,

Taking log-difference on both sides of the equation yields,
GDP growth rate
=labour productivity growth rate
+employment ratio growth rate
+labour participation growth rate+the growth rate of the population older than age 15
To calculate the long-term growth rate for China, we estimated the convergence speed of China’s labour productivity by using Chinese historical data after 2008 with an AR(1) specification, adopting the population forecast from the United Nations and then assuming a stable employment rate and a slight decline in the labour-force participation rate.
[2] Sun Yu and Demetri Sevastopulo, ‘China targets rare earth export curbs to hobble US defence industry’, Financial Times, 16 February 2021, https://www.ft.com/content/d3ed83f4-19bc-4d16-b510-415749c032c1.
This is an output of China Horizons, Bruegel's contribution in the project Dealing with a resurgent China (DWARC). This project has received funding from the European Union’s HORIZON Research and Innovation Actions under grant agreement No. 101061700.

About the authors
Related content

China economic database
Repository of what we consider to be the most relevant macroeconomic data for China and EU-China relations.

EU-China relation and de-risking global decarbonisation

China's continued focus on the same export-driven model is bound to hit an impasse
