European clean tech tracker
This tracker provides an overview of the main innovation, manufacturing and deployment trends in clean tech in Europe

This tracker will be regularly updated and expanded. It represents a compilation and elaboration of publicly available data to the best of our knowledge. We encourage stakeholders to provide us with their feedback and eventual additional data, so to strengthen and expand the tracker’s coverage over time. Please email [email protected] with any tips or feedback.
We thank Ugne Keliauskaite for her valuable research assistance.
Latest update: 28 March 2024.
Introduction
This European Clean Tech Tracker aims to provide a clear, timely and policy-relevant overview of the main innovation, manufacturing and deployment trends characterising the main technologies underpinning Europe’s green transition.
Driven by the conviction that good policy making must be informed by transparent and reliable data, this tracker seeks to become a useful tool to inform public and private decision-making processes, as well as the broader public discourse on Europe’s green transition.
Clean tech data in Europe remains significantly fragmented and difficult to access, and it is often only available on a commercial basis. This is problematic, because public data on clean tech innovation, manufacturing and deployment is essential to guide Europe’s green transition moving forward.
The aim of this tracker is to deliver comprehensive insights into the evolving landscape of clean technologies across Europe, encompassing manufacturing processes, deployment rates, innovation trends, employment statistics, subsidy allocations, and international benchmarks. It will cover a wide array of clean technologies including solar photovoltaic (PV) systems, wind energy, electric vehicles (EVS), electrolysers, heat pumps, nuclear energy, power grids, carbon capture and storage (CCS) and hydropower, among others, with regular updates to reflect the latest developments.
An important caveat: this Tracker is conceived as a rolling exercise and will be regularly updated and expanded. Its first version represents a compilation and elaboration of publicly available data to the best of our knowledge. We encourage stakeholders to provide us with their feedback and eventual additional data, so to strengthen and expand the Tracker’s coverage over time.
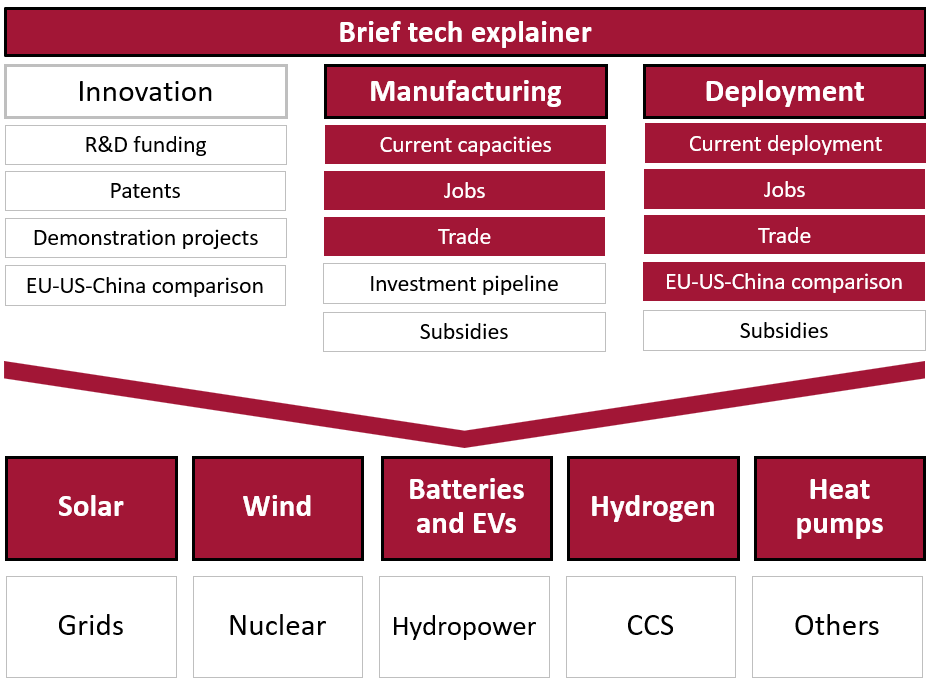
For the time being, the European Clean Tech Tracker maintains a focus on five key technologies, and it is structured as follows:
Tracker structure (Only the items in red are covered in the current version of the tracker)
Highlights
Europe is home to more than 400 clean tech manufacturing plants. Looking at the number of facilities along the supply chains for different clean technologies provides useful insights into regional specialisations and the spread of technological focus:
- Germany is a central hub for clean tech and hosts the highest number of clean tech manufacturing facilities overall and in almost all technologies.
Regional specialisation:
- Solar technology: Germany and France have the most manufacturing presence with 16 and 13 facilities respectively.
- Wind technology: Germany is by far the main player with 64 facilities. Spain and Denmark also show strong manufacturing presence in wind technology, with 38 and 13 facilities respectively.
- Heat pumps: Italy leads the way with 27 facilities, followed by Germany which has 24 and Czechia which has 8 facilities.
- Batteries: Though data is limited, Germany's 4 battery facilities suggest an emerging focus.
Caveat: the number of plants does not allow us to grasp manufacturing capacities, as the scale and productivity of each facility might differ significantly. As more data becomes available, we will seek to shed light on manufacturing capacities in future updates.
While not definitive, announced investments in solar PV manufacturing plants are useful to understand the possible trajectories of various European countries in the clean tech industry. Our data point to a potential significant increase in ingots, wafers, cells and modules manufacturing in Germany, Spain and France. Again, as only a small fraction of all these announced investments are final investment decisions (FiDs), this data should be handled with care.
Which countries lead clean tech roll-out across Europe? A per-capita perspective at the deployment of the various technologies allows us to get interesting insights on the geography of Europe’s green ambition. Solar energy deployment is surprisingly much stronger in North-Western European countries such as the Netherlands, Germany and Belgium than in the ‘sunny South’. Nordic countries lead the deployment of wind energy, with Sweden, Denmark and Finland at the forefront. Nordic countries are also leading the deployment of heat pumps, defeating the false myth that heat pumps do not properly work in cold climates. Finally, Nordic and North-Western European countries also lead in the EVs sector.
The charts below show the per capita deployment of clean technologies for the top ten performers and compare them with the Europe-wide average.
The current speed of transition, alongside total deployment, is critical for evaluating progress. This solar and wind speedometer provides a perspective on how quickly solar PV and wind are growing as a share of total electricity demand, offering a dynamic view of the energy transition between 2019 and 2022. The Netherlands, Cyprus, and Spain are the frontrunners of solar energy, while Romania, Ireland and Latvia are lagging behind. Sweden, the Netherlands, and Finland are the frontrunners in wind energy, while Cyprus, Austria and Portugal are the laggards.
Offshore wind has a huge potential in Europe, but it currently remains largely untapped, with most countries having zero installations despite having extensive coastlines suitable for it. Of the 238 GW of installed wind capacity, only 12% is offshore. Front runners in this space are North Sea countries: the United Kingdom, Germany, the Netherlands, Denmark and Belgium. Countries that indeed have big plans for offshore wind development in the future.
So far, electric cars have been for the wealthy. This is unsurprising, given their considerably higher cost vis-à-vis internal combustion engine models. Data illustrates that economic prosperity (proxied by GDP per capita) has typically supported higher adoption of EVs. Norway has an extraordinarily high number of EVs per capita compared to all other countries across Europe, followed by Sweden and Luxembourg. The relationship is not strictly linear, as some countries with high GDP per capita like the United Kingdom and Ireland have a moderate number of EVs per capita, suggesting that other factors such as government policies, infrastructure for EVs and cultural attitudes towards green technology also play a significant role. However, lower adoption in countries with lower GDP per capita – such as Bulgaria, Slovakia, and Poland - confirms the key economic barrier to adoption. We can well expect this trend to reverse in the coming years, as EVs become cheaper and more accessible to all – and thus will no longer be just for the wealthy.
Solar energy
A solar photovoltaic (PV) panel is a device that converts sunlight into electricity using semiconductor materials. Solar PV systems come in various sizes and configurations, ranging from small residential setups to large utility-scale installations. The choice of system depends on energy needs, space, irradiance and whether connection to the grid is required.
Solar panels produce direct current (DC) electricity, but most household appliances and the electrical grid use alternating current (AC). The conversion process from DC to AC results in energy losses. Capacities of solar PV systems are usually reported in DC units, representing 100% capacity. However, when referring to the operating capacity delivered to the grid, it is typically reported in AC units, which can be around 10-30% less
1
The exact rate varies from country to country depending on several factors such as type of inverters, system size, curtailment and usage, average temperatures, and so on.
. Capacity targets and installed capacity are sometimes expressed differently as a result:
- Capacity targets, like those in the EU Solar Strategy, may be given in AC units (e.g., GW in AC). The strategy targets "bringing online over 320 GW of solar photovoltaic by 2025 and almost 600 GW by 2030" which refers to AC capacity. Translated into DC units, or actual deployment results in over 380 GW of solar photovoltaic by 2025 and almost 750 GW by 2030"
2
See EU Market Outlook for Solar Power 2022-2026, Solar Power Europe.
.
- When discussing the installed capacity in different countries or up to a certain year, it is usually expressed in DC units unless stated otherwise.
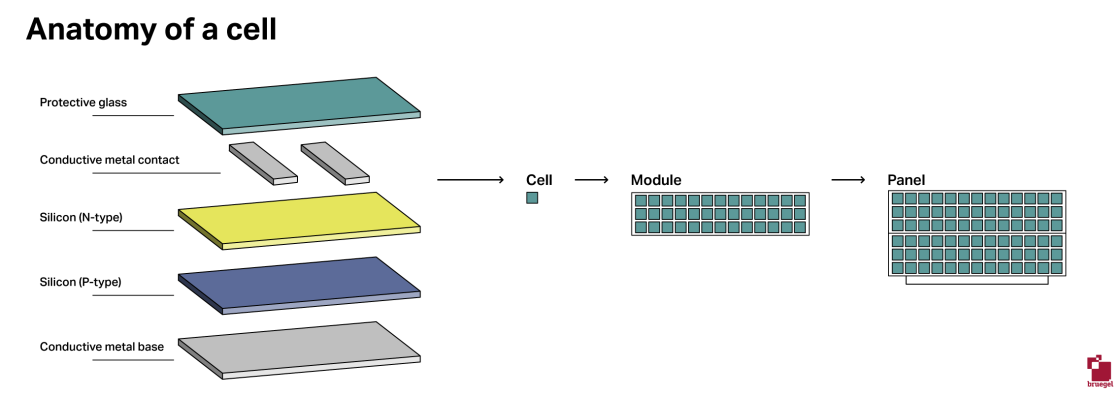
In focus: What are the components of a solar PV system?
While technological innovation is progressing fast, current mainstream solar PV systems generally have a similar structure and components as follows:
- Polysilicon (Polycrystalline Silicon): Polysilicon is the starting material for most solar PV cells. It's a high-purity form of silicon derived from raw silicon feedstock through a purification process.
- Ingot and wafers: After this purification process, polysilicon is melted and cast into a solid block, called an ingot. These ingots are then sliced into thin solar wafers, typically less than 0.2 mm thick. Wafers are the individual building blocks for solar PV cells.
- Cell: Solar PV cells are semiconductor devices that convert sunlight into electricity when exposed to sunshine.
- Modules: A PV module consists of many PV cells wired in parallel to increase current and in series to produce a higher voltage. Modules with 36 cells are the industry standard.
- Panels: PV panels include one or more PV modules assembled as a pre-wired, field-installable unit.
- Array: A PV array is the complete power-generating unit, consisting of any number of PV modules and panels.
- Inverter: The inverter converts the DC electricity generated by the solar panels into AC electricity that can be used in a household or exported to the grid.
Global manufacturing throughput 3 Note that these figures represent the potential electricity generation capabilities of the solar PV systems that could be constructed using the manufactured components from these facilities. For example, a capacity of 2 GW in solar cells means the factory can produce enough solar cells annually to generate 2 gigawatts of power under standard test conditions. Similarly, a 1.3 GW capacity for wafers indicates the production of enough wafers to potentially assemble solar PV systems capable of generating 1 GW of power. in 2022 was around 260 GW, significantly below the 640 GW of installed manufacturing capacity. Utilisation rates vary by component ranging from 50% for wafers and 70% for cells, but they are generally low due to rapid expansion in recent years and a shift toward new cell technologies.
China dominates each step of the manufacturing value chain of solar PVs.
In Europe, European manufacturers produced 26 GW of polysilicon, 1 GW of ingots, around 1 GW of wafers, around 2 GW of cells, more than 14 GW of modules and 82 GW of inverters in 2023. Also note that the manufacturing capacity of polysilicon and inverters is not exclusively devoted to solar PVs
Note that these figures represent the potential electricity generation capabilities of the solar PV systems that could be constructed using the manufactured components from these facilities. For example, a capacity of 2 GW in solar cells means the factory can produce enough solar cells annually to generate 2 gigawatts of power under standard test conditions. Similarly, a 1 GW capacity for wafers indicates the production of enough wafers to potentially assemble solar PV systems capable of generating 1 GW of power.
Manufacturing facilities are located across Europe, but they are concentrated especially in Germany, followed by France and Italy.
As part of RePowerEU, the EU Solar Energy Strategy aims to install 420 GW of additional EU solar capacity by 2030 to bring total solar installed capacity to 585 GW (this is expressed as AC capacity which translates to almost 750 GW in DC capacity by 2030). This implies that new capacity of around 48 GW should be added annually.
In 2022, 43.5 GW capacity was added to the grid in Europe, totalling 220 GW. In EU27, total installed solar photovoltaic capacity stood at around 205 GW in 2022.
Comparing installed solar capacity per capita allows for a fairer comparison across countries. The Netherlands led the way with 1.1 kW per capita installed, followed by Germany with 0.8 kW per capita installed and Belgium with 0.6 kW per capita installed.
Speedometer
The current speed of transition, alongside total deployment, is critical for understanding how countries are progressing. Our solar speedometer provides a perspective on how quickly solar PV is growing as a share of total electricity generation compared to electricity demand, in the years 2022 and 2019.
The Netherlands is leading the way, having increased its solar energy contribution to the electricity mix by 10 percentage points since 2019. Cyprus follows with an increase of 7.3 percentage points and Spain has boosted its solar share by 6.9 percentage points.
It is important to note that this measurement is influenced by changes to absolute electricity generation, initial solar generation in 2019 and changes in the imports of electricity from other countries.
In 2022, direct and indirect employment in the solar PV sector in EU27 increased by 48% compared to 2021, reaching a total of 346,900 full-time equivalent (FTE) jobs
4
Data include both direct and indirect employment. Direct employment includes RES equipment manufacturing, RES plants construction, engineering and management, operation and maintenance, biomass supply and exploitation. Indirect employment refers to secondary activities, such as transport and other services. See: Eur’Observatory Methodology https://www.eurobserv-er.org/wp-content/uploads/employment-and-turnover….
. According to industry estimates, around 84% of the workforce is in deployment, around 7% is in manufacturing and 8% in operation and maintenance, and around 1% in decommissioning and recycling
5
See SolarPower Europe, EU Solar Jobs Report 2023, https://api.solarpowereurope.org/uploads/1823_SPE_Jobs_report_09_0953d3…
.
Germany leads with 87,100 jobs, followed by Poland with 44,100 jobs and Spain with 36,300 jobs respectively. On the other hand, Luxembourg, Slovakia, and Malta have established smaller-scale solar PV sectors with employment numbers currently standing at less than 300, 200, and 100 jobs.
The EU is a net importer of solar panels, with net imports approximately €10 billion in 2021. Large imports occurred in 2010 and 2011 when many European governments provided large subsidies for households to install solar panels. As these schemes were abruptly ended, so too were imports. This was also driven by the introduction of anti-dumping measures on imports from China in 2013.
In absolute terms, as of 2022, China's total installed capacity stands at 393 GW, nearly doubling the EU's 205 GW and surpassing the USA's total of 113 GW by more than threefold. Over the past five years, from 2017 to 2022, solar capacity installations among China, the EU, and the USA have demonstrated distinctive growth trajectories. China exhibits a compound annual growth rate (CAGR) of approximately 25%, the USA of 21% and the EU of 16%
In 2022, the EU solar sector employed 648,000 FTEs, with deployment roles comprising 80%, operation and maintenance 8%, and manufacturing 7%. The US solar sector reached 264,000 jobs; 65% were in installation and project development, 12.6% in manufacturing, and 10.7% in operation, maintenance, and other roles. China's solar industry employed 2.76 million individuals, with manufacturing roles representing approximately 1.8 million and the remaining 918,000 jobs in construction, installation, and O&M, despite increasing automation.
Wind energy
Wind turbines are devices designed to harness the kinetic energy of the wind and transform it into electricity. These turbines can be placed either on land (onshore wind turbines) or in large bodies of water such as oceans and lakes (offshore wind turbines). Regardless of the type, wind turbines generally have similar components.
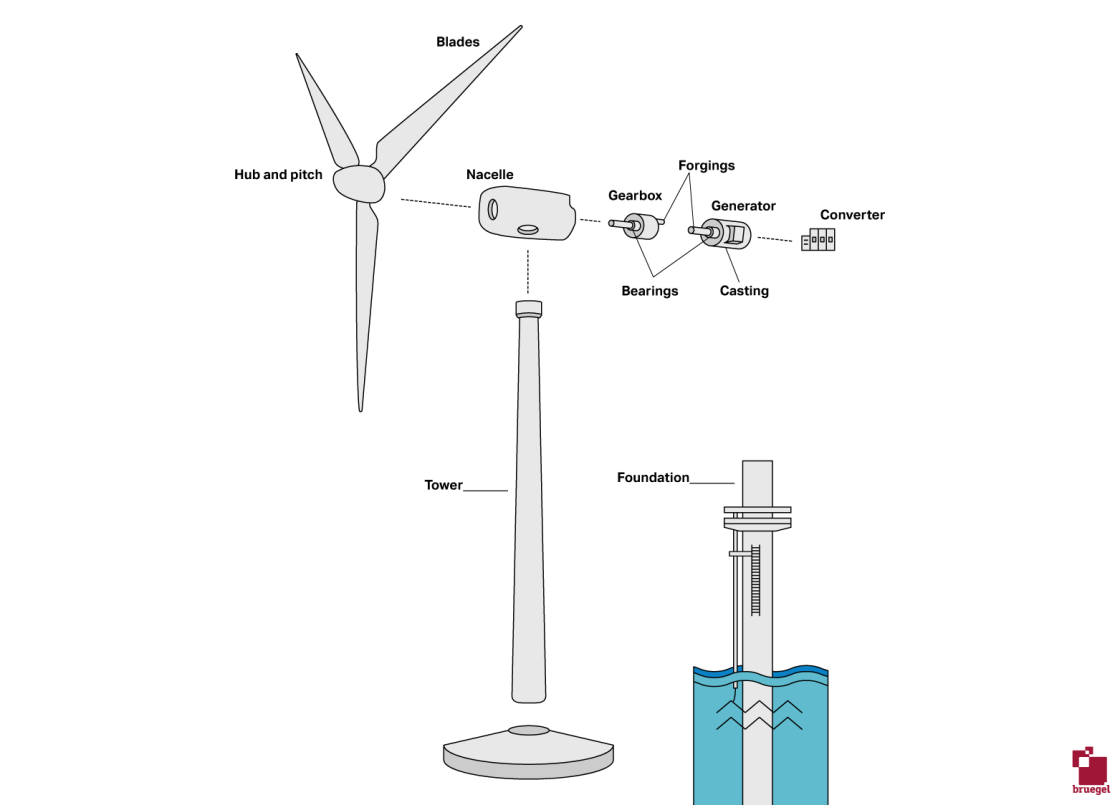
In focus: What are the components of a wind turbine?
- Rotor blades: they mimic the principles of aircraft wings, with one side curved and the other flat, creating varying air pressures that drive the blades to rotate. Typically, wind turbine blades rotate between 13 and 20 revolutions per minute, with their velocity adjusted to optimize efficiency relative to wind speed.
- Nacelle: housing the gearbox and a generator, it links to the turning blades via the gears, converting the slower blade rotation into the generator's speed of approximately 1500 rpm. Ultimately, the generator transforms the rotational energy from the blades into electrical power.
-
Tower: to optimise the performance of nacelles, these components are mounted on tall towers, typically ranging from 50 to 100 meters above the ground or water surface. In offshore applications, towers are often anchored to the seabed, though ongoing research explores the possibility of floating towers.
The global wind turbine market is dominated by ten major manufacturing companies, satisfying 88% of demand. Five of those companies are headquartered in the EU: Vestas, Siemens Energy, Enercon, Nordex SE and GE Renewable Energy. China has emerged as a global competitor to the European wind industry, boasting headquarters for four of the top ten wind turbine manufacturers, including Goldwind and Envision. Over the past decade, a reduction in the number of manufacturers has occurred, driven by factors including pricing pressures from auctions and uncertainties in market volumes, especially in Spain and Germany.
In terms of specific components, in 2022, European manufacturing capacity was around 25 GW for blades, 28 GW for nacelles and 2.1 million metric tons for towers.
6
See The State of the European Wind Energy Supply Chain, Rystad Energy. https://www.rystadenergy.com/insights/the-state-of-the-european-wind-en…
Manufacturing facilities are in several European countries, but they are concentrated especially in Germany, Denmark and Spain.
As part of RePowerEU, the EU aims to expand installed wind capacity to 420 GW by 2030, requiring an average annual deployment of 28.5 GW between now and 2030. This would meet the anticipated share of wind energy in the 42.5% renewable energy target by 2030.
In 2022, EU Member States collectively added 15.6 GW of new capacity, which increases to 18.4 GW when incorporating Norway and the United Kingdom. The total installed capacity, encompassing both onshore and offshore installations, reached 203.5 GW for the EU27, increasing to 237 GW when incorporating Norway and the United Kingdom. Out of this cumulative total, 12% (29 GW) are offshore installations, while 88% (207 GW) are onshore.
Germany leads with 58 GW of onshore capacity and 8 GW of offshore wind capacity installed, followed by Spain with 30 GW of onshore capacity and the United Kingdom with 15 GW of onshore capacity and 14 GW of offshore capacity.
Considering installed wind capacity per capita allows for a more critical comparison across countries. Here, Sweden leads the way with an average of 1.4 kW per capita installed, followed by Denmark with 1.2 kW per capita and Finland with 1 kW per capita installed.
Speedometer
The current speed of transition, alongside total deployment, is critical for understanding how countries are progressing. The wind speedometer provides a perspective on how quickly wind is growing as a share of total electricity generation compared to electricity demand, in the years 2022 and 2019. This is not an assessment of the countries leading the way in terms of wind penetration, but rather the speed of integration into the electricity mixes over the last three years.
Sweden leads with an increase of 10.1 percentage points, followed by the Netherlands with 9.1 percentage points and Finland with an increase of 7.3 percentage points.
It is important to note that this metric is influenced by changes to absolute electricity generation, initial wind generation in 2019, and changes in electricity imports.
In 2022, direct and indirect employment in the wind energy sector increased by around 30% compared to 2021, reaching a total of 273,500 full-time equivalent (FTE) jobs
7
Data include both direct and indirect employment. Direct employment includes RES equipment manufacturing, RES plants construction, engineering and management, operation and maintenance, biomass supply and exploitation. Indirect employment refers to secondary activities, such as transport and other services. See: Eur’Observatory Methodology https://www.eurobserv-er.org/wp-content/uploads/employment-and-turnover….
.
Germany leads with 85,600 jobs, followed by Spain with 37,100 jobs and France with 36,500. Notably, employment in Denmark decreased from 31,900 to 22,600 jobs. On the other hand, Malta, Slovenia and Slovakia have a smaller wind sector with each having less than 100 direct jobs.
The EU is a net exporter of wind technology with exports of almost €4 billion from the EU to the rest of the world in 2021, and imports of just under €1 billion. Exports have been consistent over the past ten years at around €3 billion per annum, while imports have been growing substantially since 2020.
In 2022, China had the highest installed wind capacity at 366 GW, the EU follows with 203 GW, demonstrating a strong commitment to wind energy, while the USA trails with 141 GW. Over the past five years, from 2017 to 2022, wind capacity installations among China, the EU, and the USA have demonstrated distinctive growth trajectories. China exhibits a compound annual growth rate (CAGR) of approximately 17%, the EU, while showing steady progress, has grown at a modest pace with a CAGR of about 6%. The USA strikes a middle ground with a moderate CAGR of around 10%.
The EU wind industry supports an estimated 273,500 jobs. According to industry reports, around two thirds are direct jobs and one third represents indirect jobs. In the sector, 28% are employed by turbine and component manufacturers.
China's wind industry workforce reached 681,000 in 2022. Of these, around 41% works in construction and installation, 34% in manufacturing, and 25% in operation and maintenance (O&M).
In the US, wind power employment grew to 125,580 in 2022. Onshore wind jobs were predominantly in construction (36%) and professional/business services (26%). Offshore wind jobs were led by services (48%) and construction (32%).
Batteries and electric vehicles
Europe has long been a world leader in the manufacture of internal combustion engine vehicles. This manufacturing base is now rapidly pivoting toward the production of electric vehicles. While certain elements of the car remain similar and can utilise existing value chains, the key development is the need for a battery which typically comprises around 30% of the vehicle's value. This is most commonly a lithium-ion battery, although the development of sodium-ion batteries is an exciting development.
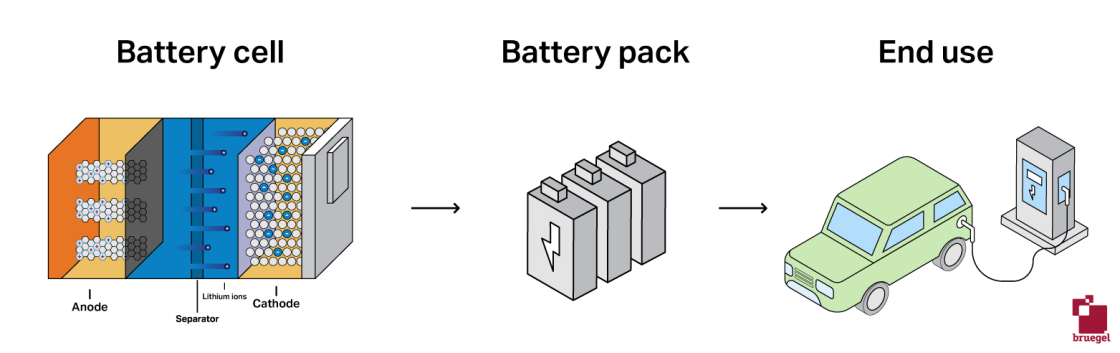
In focus: What are the components of a lithium-ion battery?
A lithium-ion battery is composed of layers of thin sheets of aluminium and copper separated by an electrolyte (typically liquid, but an exciting innovation is for this to be solid). Desired chemical properties are achieved by coating these metals sheets with chemical compounds of lithium, nickel, cobalt, manganese, and graphite to create electrodes. These elements are extracted from the earth in raw form and must undergo energy intensive refining before suitable purity is reached for use in a battery.
After refining, these compounds are combined and further processed to produce a powder, known as battery active materials. When mixed with a solvent, this powder forms a paste that can be coated onto metals ready for assembly into the final battery. Two separate electrodes are produced, the cathode (positive electrode) and anode (negative electrode) and the flow of electrons between the two generates an electric current.
We estimate that as of 2023 the EU has 204 GWh cell manufacturing capacity, which compares to a demand of 210 GWh (for both electric vehicles and energy storage systems). The EU’s current deployment needs are covered by domestic battery manufacturing.
The following chart shows operational and under construction battery factories in Europe as of 2023, which amount to just under 600 GWh. Assuming existing company manufacturing plans, the EU will continue to retain the capacity to manufacture cells for between two-thirds and all of its final EV battery demand.
However, the EU is typically able to meet a substantially lower share of demand for inputs to cell manufacturing such as refined lithium, nickel, and cobalt as well as battery active materials, and is therefore reliant on imports. Future versions of this clean tech tracker will analyse each of these components in more detail.
The following chart displays monthly registrations of electric vehicles (both pure battery electric and plug-in hybrid) by country. This is expressed as a share of all monthly vehicle registrations. So, a 20% share means for a given month 1 in every 5 newly purchased cars was electric.
In 2023, 22% of new cars registered in the EU were electric (14.5% pure battery electric and 7.5% plug-in hybrid). This increased marginally from 21% in 2022 (12% pure battery, and 9% plug-in hybrid). In 2021, 18% of new cars registered were electric, with an even split between pure battery and plug-in hybrid models.
For context, in 2022, 14% of cars sold globally were electric, 29% of cars sold in China were electric and 8% of cars sold in the USA were electric.
The EU’s target of all new vehicles sold in 2035 to be zero-emission will not solve the emissions challenge. The turnover rate of cars is typically slow and from the point at which 100% clean vehicle sales are achieved it will take many more years for the whole car stock to transform.
The following chart plots the overall deployment of electric vehicles by country as a share of all passenger vehicles. The darker blue bar shows deployment by the end of 2022, while the lighter blue bar shows expansion in 2023 so far. For the EU, we estimate 3.1% of cars currently on the road to be electric. This compares to 4.9% for China, 1.3% for the USA and 2.1% globally by 2022 8 See IEA, Electric Vehicles, https://www.iea.org/energy-system/transport/electric-vehicles .
The EU is a net importer of batteries from the rest of the world, despite sizeable exports of €10 billion in 2021. Since 2016, imports have grown consistently and tripled in volume from around €6 billion to €18 billion.
As of 2022, the EV stock for China, the EU27, and the USA presents significant absolute figures that reflect the status of EV adoption in each region. China leads with a staggering 14.1 million EVs, which is more than double the EU27's stock of 5.7 million and nearly five times greater than the USA's stock of 2.96 million.
Between 2017 and 2022, EV stock in China has increased by 63%, which underscores its rapid market expansion and strong governmental support for EVs. The EU27 follows closely with a CAGR of 62%, indicative of robust policy frameworks and consumer incentives driving EV adoption. The USA, while showing significant growth, has a lower CAGR of 31%, which may suggest comparatively slower market penetration and a diverse set of incentives impacting EV adoption rates.
Hydrogen
Hydrogen by itself is not a ‘clean technology’, but an element which has important economic use cases in decarbonised economic systems. Relevant corresponding technologies include those for the production and consumption of hydrogen – which we focus upon in this tracker – as well as transport and storage.
Hydrogen is the most abundant element in the universe but on earth it does not typically occur alone, rather in combination with other elements, for example in the form of methane (CH4) or water (H2O). Industrial processes liberate the hydrogen element from such compounds for subsequent economic use.
The dominant form of hydrogen production in the European Union (> 90% share) is steam methane reforming whereby hydrogen is extracted from methane, with waste carbon dioxide typically released into the atmosphere. For this reason, the production of hydrogen is currently one of the most greenhouse gas intensive industries in the EU. The EU’s Hydrogen Strategy focuses on the potential to produce hydrogen using water electrolysis - electricity breaks water down into hydrogen and oxygen molecules. Assuming the electricity used is renewable, this process has zero direct greenhouse gas (GHG) emissions.
Three important properties of hydrogen make it a useful element already today, and they may suggest further uses in decarbonised energy systems:
- Its chemical properties make hydrogen essential for certain manufacturing processes, particularly for the production of ammonia. It it is currently the most advanced decarbonisation pathway for steel.
- Its high energy density by weight makes it a potentially attractive option for decarbonisation in cases where electricity is hardly an option, eg, aviation.
- As a gas, it is easier to store than electricity, so it is considered potentially helpful to absorb seasonal misbalances in future electricity generation and demand.
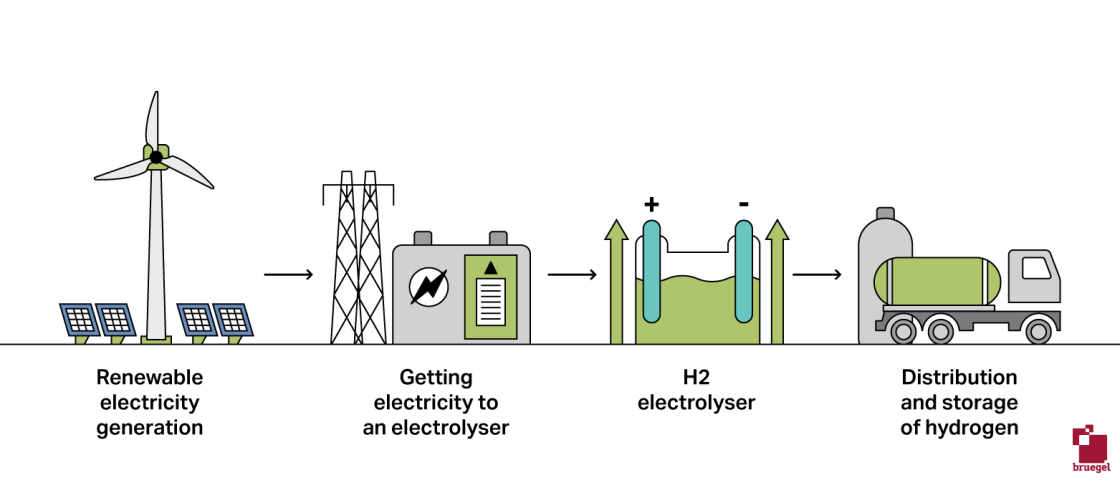
Electrolysers are the clean technology required for electrolysis. Europe (EU27 and EFTA) has substantial manufacturing capacity, with over around 5 GW operational capacity and a further 1 GW under construction or having taken a final investment decision as of 2023. This compares to electrolyser deployment of 54 MW in 2022, and deployment of 215 MW in 2023 anticipated by the European Clean Hydrogen Alliance. Industry in the EU has set a target of achieving 25 GW manufacturing capacity by 2025 under the Electrolyser Partnership 9 See https://single-market-economy.ec.europa.eu/news/hydrogen-commissioner-b… .
Consequently, the EU currently has a manufacturing capacity 40 times its annual deployment and is still growing. The reason is anticipation that volumes of electrolysers deployed in the coming years will grow rapidly.
As of 2023, independent electrolysis production accounts for less than 1% of the EU’s final hydrogen demand. The most obvious decarbonisation benefits of deploying electrolysers will come from replacing existing carbon-intensive hydrogen production.
If all projects under construction were completed, by the end of 2023, Europe will have deployed 384 MW capacity (including 37 MW in Norway and 9 MW in the UK). Of this, the largest capacity is intended for use in the chemicals sector (99 MW), followed by the mobility sector (80 MW) and the refining sector (56 MW). This 384 MW capacity translates into capacity for producing 60,000 tonnes of hydrogen. In 2022, consumption of hydrogen in Europe was estimated at 8,200,000 tonnes.
Considering projects currently under construction and which are set to come online, the EU will have 1,367 MW capacity by the end of 2025. The largest planned consumer is steel (473 MW), followed by oil refining (456 MW). This capacity is contrasted with ambitions in the EU Hydrogen Strategy for deploying 40 GW electrolysers by 2030, a target which has effectively been increased through REPowerEU.
Heat pumps
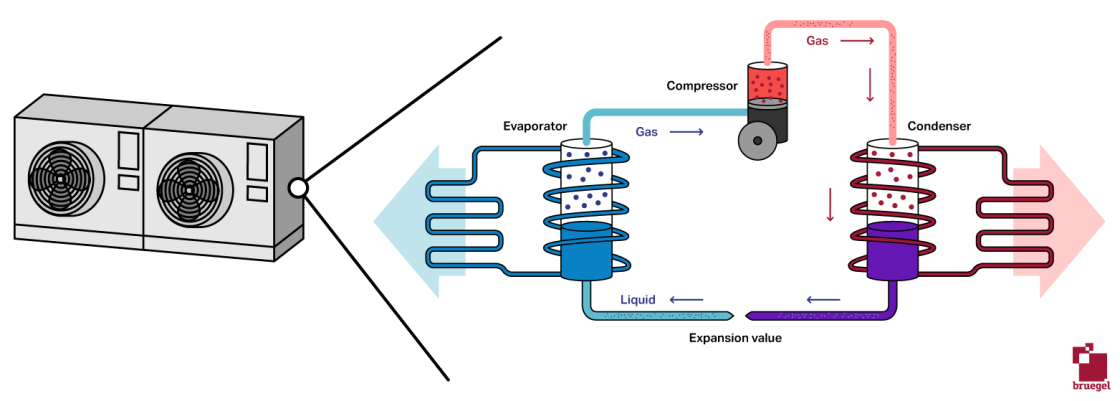
A heat pump is a system that is used to heat and cool buildings by transferring heat from one location to another, typically powered by electricity. Because heat pumps use electricity to transfer heat rather than generate it, they are remarkably energy efficient. The energy output of a heat pump is typically three to four times greater than the electrical energy used to run it (in industry terms this is called the ‘coefficient of performance’).
There are three types of heat pumps: air source, water source and ground source, differing in the heat source they tap into. The most common type is the air source heat pump, which extracts heat from the outdoor environment, even in cold weather 10 Note that heat is always present in the air so long as air temperature is above the absolute zero, i.e. -273 °C. . In buildings, the heat is delivered using either forced air or hydronic systems such as radiators or under‐floor heating. In cooling mode, the heat pump works in reverse by removing heat from the indoor air and releasing it outside.
In industry, heat pumps serve various purposes, including providing hot air, water or steam and by directly heating materials. They can be particularly efficient in large-scale applications, sourcing heat from industrial processes, data centres, or wastewater.
In focus: What are the components of a heat pump?
- Evaporator coil: located in the outdoor unit, it is responsible for absorbing heat from outdoor spaces (in heating mode)/for releasing heat outdoor (in cooling mode). It is typically made of copper or aluminium and has fins to aid heat transfer. It contains a refrigerant.
- Refrigerant: the working fluid inside the heat pump's closed-loop system. The refrigerant absorbs and releases heat as it changes from a liquid to a gas and back. The choice of refrigerant affects the efficiency and environmental impact of the system.
- Compressor: forces the refrigerant into a small area thus raising its temperature and pressure, allowing it to efficiently move heat from one place to another and sends it to the condenser coil. This component is the one that consumes the most electricity.
- Condenser coil: located in the indoor unit, it is responsible for releasing heat into indoor spaces (in heating mode) or by absorbing heat from indoor spaces (in cooling mode). It is typically made of copper or aluminium and has fins to aid heat transfer.
- Reversing valve: allows the refrigerant flow to change direction when switching from heating to cooling mode. It is located near the compressor.
In 2021, global heat pump production capacity, excluding air conditioners, reached 120 GW 11 See IEA, Energy Technology Perspectives, 2023 https://www.iea.org/reports/energy-technology-perspectives-2023 . China is the primary supplier of compressors for air-air pumps, while Europe leads in the production of air-water and ground-source heat pumps 12 See JRC, Clean Energy Technology Observatory: Heat Pumps in the European Union – 2022 Status Report on Technology Development, Trends, Value Chains and Markets, 2022 https://publications.jrc.ec.europa.eu/repository/handle/JRC130874 . In 2022, heat pump manufacturing capacity in Europe was 22 GW.
The Net-Zero Industry Act (NZIA) sets a manufacturing capacity target for heat pumps at 31 GW a year by 2030. However, the European Heat Pump Association (EHPA) suggests that, even in a conservative growth scenario, manufacturing capacity could reach around 47 GW annually by 2030.
The stock of heat pumps in Europe amounts to 19.8 million units
13
The estimates assume a life expectancy of around 20 years and refers to the cumulative stock in the period 1997-2022.
, equivalent to a thermal capacity of around 174 GW. In 2022, 3.01 million heat pumps were sold in Europe, equivalent to a thermal capacity of around 28.2 GW. The heat pump market grew rapidly with a 39% deployment growth, year-on-year.
Ten countries alone account for 86% of the European market. And while France (622,000 units sold), Italy (514,000 units sold) and Germany (276,000 units sold) lead in terms of absolute sales in 2022, the largest increase year-on-year was registered in Poland with 110,000 units sold increasing by 112% compared to 2021.
The relative deployment picture by countries is different when considering heat pump adoption as a share of households. Here, Norway leads the way with 65% of households estimated to own a heat pump, followed by Finland (56%) and Sweden (46%).
In 2022, direct and indirect employment in the heat pump sector increased by around 10% compared to 2021, reaching a total of 416,200 full-time equivalent (FTE) jobs
14
Data include both direct and indirect employment. Direct employment includes RES equipment manufacturing, RES plants construction, engineering and management, operation and maintenance, biomass supply and exploitation. Indirect employment refers to secondary activities, such as transport and other services. See: Eur’Observatory Methodology https://www.eurobserv-er.org/wp-content/uploads/employment-and-turnover….
, making heat pumps the largest renewable energy sector in the EU in terms of employment, followed by PV. According to industry estimates, around 57% is in manufacturing, 31% installations, and 13% in operation and maintenance.
While jobs decreased with respect to 2021, Italy still leads with 135,400 jobs. It is followed by France, Spain and Germany, with 80,300, 32,200 and 31,900 jobs respectively. On the other hand, Croatia, Luxembourg, and Latvia have relatively lower direct employment figures, with each having less than 100 direct jobs.
In 2022, the EU heat pump totalled 416,200 full-time equivalent (FTE) jobs 15 Data include both direct and indirect employment. Direct employment includes RES equipment manufacturing, RES plants construction, engineering and management, operation and maintenance, biomass supply and exploitation. Indirect employment refers to secondary activities, such as transport and other services. See: Eur’Observatory Methodology https://www.eurobserv-er.org/wp-content/uploads/employment-and-turnover…. . It became the largest renewable energy employment sector, surpassing solar PV. Of these jobs, 56% are in manufacturing, 31% in installation, and 13% in operation and maintenance.
China's heat pump industry employed around 118,000 people in 2022, excluding air-to-air heat pumps. Equipment production involved 28,000 individuals, component production 20,000, while sales, logistics, installation, and after-sales comprised 70,800 jobs, accounting for 60% of the sector.
The US reported 6,465 jobs in ground-source or geothermal heat pumps in 2022, with a significantly higher 64,641 jobs in the air-source heat pump segment. Of this, around 22% is in manufacturing, 59% is in installation, and 20% in O&M.
Financial support from the European Climate Foundation is gratefully acknowledged.
About the authors
Related content

The Letta report: an assessment of the energy proposals
The report has the potential to substantially impact the European Union's strategic agenda from 2024-29

Beyond the numbers of EU national energy and climate plans
The authors conduct a simple relative frequency analysis for a series of words mentioned in the NECPs to identify interesting policy insights within

A smart industrial policy to fast-charge Europe’s electric vehicles revolution

European natural gas imports
This dataset aggregates daily data on European natural gas import flows and storage levels.