Fact of the week - The tiny balance sheet impact of the TLTRO (charted)
While waiting for the ECB to start QE purchases in March, an update of our Eurosystem liquidity database allows capturing the (non)-impact o
While waiting for the ECB to start QE purchases in March, an update of our Eurosystem liquidity database allows capturing the (non)-impact of the TLTRO announced by the ECB in June 2014.
TLTRO potential initial amount for the first two operations was in the order of 400 billion, i.e. 7% of the outstanding banks’ loans to non-financial private sector borrowers, excluding mortgages as of 30th April 2014. Take-up was 82.6 billion in September and 130 billion in December, bringing the total to 212 billion, i.e. slightly more than half the potential total amount (see here and here for previous assessments).
The ECB’s optimistic presentation of this measure notwithstanding, the updated numbers on use of ECB liquidity suggest that it has had almost no impact on the ECB balance sheet size. By the end of 2014 there has been no increase in the use of Eurosystem liquidity (figure 1), only a slight stabilisation of levels can be observed. The minutes of the Governing Council meeting on 22nd January, which were published yesterday, suggest that internally the ECB was in fact worries that “the total estimated take-up over all eight TLTRO operations was significantly lower than envisaged in September 2014”, and that this was one of the reason prompting the ECB to announce the additional asset purchases.
Figure 1 Country use of Eurosystem Main and Longer-Term Refinancing Operations (01/2003-12/1214, in EUR bn)
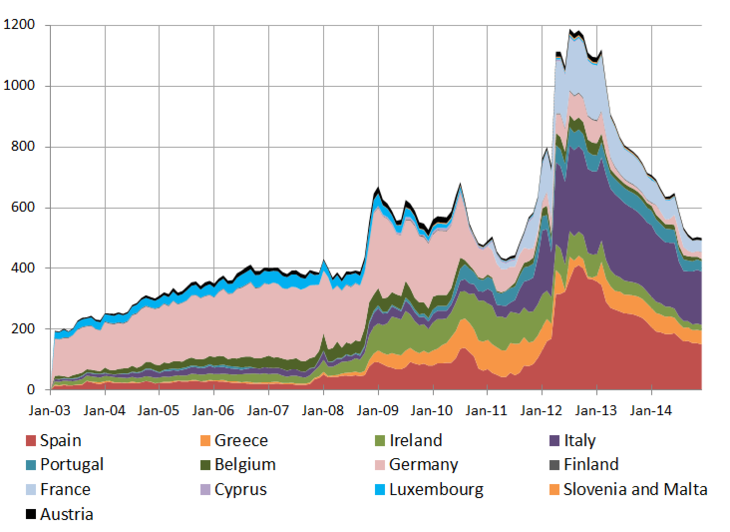
Source: National central banks. Note: Due to missing data for several countries, the figure does not include all 18 Euro area countries
More light can be shed on this issue when decomposing the Eurosystem liquidity by maturity. As can be seen in Figure 2, the stabilisation in levels from September to December 2014 was due to the newly injected TLTRO liquidity making up for ever falling LTRO liquidity. Only the December TLTRO auction actually led to a net increase in the stock of Eurosystem liquidity. The fact that this increase is tiny is not particularly surprising, as we had documented already that the potential net additional liquidity would have been small.
Figure 2 Eurosystem refinancing operations by maturity (01/2007-01/2015, in EUR bn)
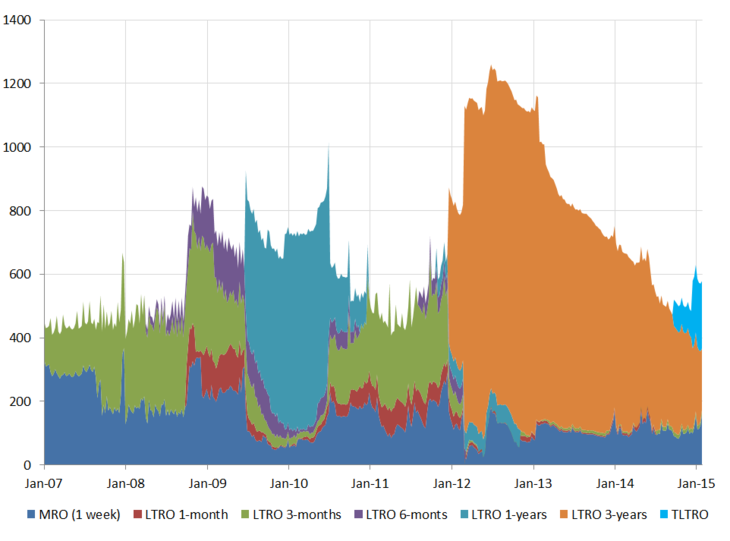
Source: Bruegel calculations based on ECB
Despite the recent spike, early repayments of previously borrowed LTRO funds - which had accelerated before the TLTRO auctions - have been contributing to a continuous decrease in the ECB balance sheet and looking ahead (as repayments continue), further downward pressure on excess liquidity[1] can be expected. The EONIA has not increased - it has turned into slightly negative territory in fact - but this is mostly the result of the negative interest rate on the deposit facility. Before the crisis, in fact, the ECB’s main refinancing rate would steer short-term money market rates, resulting in a close alignment of the EONIA and the MRO rate. The increase in the amount of excess liquidity in the system pushed the EONIA to the bottom of the interest rate corridor, i.e. just a few basis points above the rate on the ECB deposit facility, which is the lowest possible bound for the EONIA, as banks are unlikely to lend money on the money market at a cheaper rate. This means that since the introduction of the full allotment, the rate on the ECB deposit facility has become the main driver of money market rates and the EONIA.
Figure 3 Excess Liquidity and EONIA
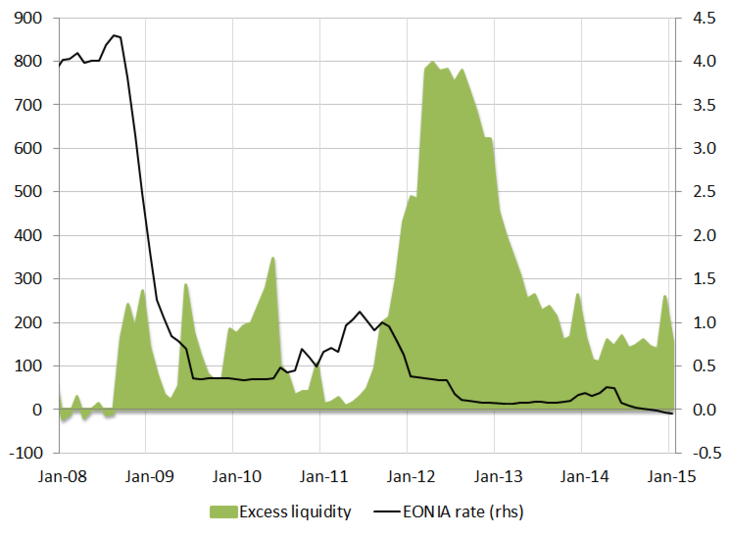
Source: ECB and BUBA. Note: Excess liquidity is computed following the ECB definition as deposit facility net of the use of marginal lending facility plus current account in excess of the minimum reserve requirement.
There are a number of factors possibly playing a role in the low take up of the TLTRO operation. As pointed out earlier, the ECB itself might have modified the reaction function of banks, with its announcement of an ABS programme and the growing expectations of QE in December. Knowing that the ECB was going to start buying ABS soon, and knowing that the ECB would hardly buy ABS that it would not accept as collateral, banks might have preferred to wait and sell those ABS to the ECB rather than just pledge them in the TLTRO in September. A similar reasoning might have been at play in December, when they had become overwhelmingly convinced that the ECB had to act.
The TLTRO, however, was not only aimed at increasing the balance sheet size, but also (and most importantly) at spurring fresh credit to the real economy. And indeed, from March 2015 onwards, the TLTRO is entering into its second phase - the one that should allow “leveraging” the measure beyond the initial allowances and at the same time impose incentives for banks to actually use the funds for lending to the economy. And as previously highlighted, expectations in this regard might not be too high after all.
[1] Excess liquidity is computed following the ECB definition as deposit facility net of the use of marginal lending facility plus current account in excess of the minimum reserve requirement. In other words, it is the amount of liquidity held in excess by banks at the ECB.
About the authors
Related content

Is the current crisis management framework enough for the age of digital bank runs?

Fast and furious: how digital bank runs challenge the banking-crisis rulebook
The speed of recent bank failures has shown the need for more systemic protection of the financial system.

How Europe can sustain Russia sanctions
Russia's war in Ukraine has underscored the need for Europe finally to invest more in its own defence and security. Such an outrageous act of aggressi

The microeconomics of Christmas
Review of major contributions to the literature on the controversial topic of the deadweight loss of Christmas.