The rising cost of European Union borrowing and what to do about it
Interest rates on the EU debt have risen substantially since 2022: what are the main drivers and implications and what to do about it?

Executive summary
Debt issuance by the European Commission on behalf of the European Union has increased massively. Of the approximately €400 billion in outstanding EU debt as of May 2023, 85 percent has arisen from borrowing since 2020. Large-scale borrowing is expected to continue until 2026 to fund the remainder of NextGenerationEU, and concessional loans to support Ukraine.
When these programmes were launched, interest rates were at historic lows – even negative for maturities below 10 years. However, interest rates rose sharply in 2022. Beyond the widespread rise in euro-denominated interest rates due to monetary tightening by the European Central Bank in response to the inflation surge, the EU has also faced a widening of the spread between its yields and those of major European issuers, including France and Germany. This widening is driven by a combination of market features, circumstantial factors and institutional features.
The EU cannot affect the overall cyclical movement of interest rates and will have to learn to live with it, like sovereigns do. However, the European Commission should continue to try to narrow the spread with major European sovereigns by further developing the relevant market infrastructure and improving its issuance strategy. The Commission will not be able to do this alone. Institutional developments, including progress on the development of new own resources and a long-term substantial presence in the bond market, will be necessary to fully reap the benefits of EU borrowing.
A large share of EU borrowing (around €421 billion in total by the end of 2026, in current prices) is intended to finance unprecedented non-repayable support: Recovery and Resilience Fund grants and additional funding for existing EU programmes under the EU budget. The interest costs associated with this part of the debt lie with the EU budget. Our estimates suggest that, because of the high current and expected levels of interest rates, this cost could be twice as high as what was initially estimated at the start of the EU’s 2021-27 budget cycle.
As a result, because interest costs for the borrowing of the non-repayable support are accounted for under the EU budget’s ‘expenditure ceiling’, this will exert further pressure on the funding of important EU programmes, which are already affected by inflation. The EU should thus quickly review how interest costs are accounted for in its budget and financial framework.
This Policy Brief is a version of a paper prepared for a workshop on 'EU borrowing costs: drivers and dynamics – a comparative perspective', organised on 22 May 2023 by the European Parliament Budgets Committee. Copyright remains with the European Parliament at all times.
1 Introduction
The European Commission has long issued debt on behalf of the European Union, but the scale and nature of this borrowing has changed drastically since the COVID-19 crisis. Previously, the Commission mainly issued debt to finance three lending programmes to support countries experiencing financial difficulties: the European Financial Stability Mechanism (EFSM) for euro-area countries, Balance of Payment (BoP) assistance for non-euro-area EU countries, and Macro-Financial Assistance (MFA) for non-EU countries.
While these programmes are backed by different forms of guarantee, these loans are all distributed on a ‘back-to-back’ basis, meaning that, while the recipient countries benefit from the more favourable borrowing conditions generally available to the EU, they are responsible directly for repaying the debt and interest costs incurred 1 An exception is the MFA+ programme providing support for Ukraine after the Russian invasion; for this, the EU announced that it would service the interest costs on the borrowing as a mark of solidarity. See European Commission press release of 17 January 2023, https://ec.europa.eu/commission/presscorner/detail/en/ip_23_228. . Consequently, until the COVID-19 crisis, EU borrowing was relatively small in scale and dependent on the timing of recipients’ needs, making the Commission an infrequent player on financial markets.
This changed in 2020. The EU increased its borrowing massively to create two new instruments in response to the COVID-19 crisis: Support to mitigate Unemployment Risks in an Emergency (SURE) and NextGenerationEU (NGEU). SURE was designed to reduce the financing cost of national short-term work schemes, which were a crucial tool to avoid an increase in unemployment during COVID-19 lockdowns, and consisted of €98.4 billion in back-to-back loans distributed to 19 countries between 2020 and 2022. SURE debt was issued in the form of social bonds 2 See details in https://commission.europa.eu/system/files/2020-10/eu_sure_social_bond_f…. . The ongoing NGEU programme meanwhile provides loans 3 As of April 2023, only seven countries have requested loans under this facility. The deadline for doing so is August 2023. Unclaimed loans can be used to finance RepowerEU. (up to €385.8 billion in current prices) and grants (€338 billion) to EU countries through the Recovery and Resilience Facility (RRF), and provides additional support (€83.1 billion) to six EU programmes under the Multiannual Financial Framework (MFF) 4 ReactEU, Horizon, RescEU, InvestEU, the Just Transition Fund and the European Agricultural Fund for Rural Development. .
The introduction of these two instruments changed the nature of the EU as a borrower and entailed a very significant increase in EU debt issuance. Over 93 percent of the bonds issued by the Commission between October 2020 and December 2022 went towards financing these two instruments. Of the approximately €398 billion in outstanding EU debt as of 30 April 2023, over €350 billion comes from borrowing since October 2020 – ie when SURE borrowing started 5 Between June 2021 and December 2022, €170 billion, including €36.4 billion in green bonds, was issued to support NGEU. From January 2023, the Commission moved to a ‘unified funding strategy’, meaning that EU debt is no longer issued per programme, but through general EU bond. As a result, the breakdown of the share of issuances by programme stops at the end of 2022. . As a result, EU total outstanding debt (Figure 1) is already larger than the debt of EU countries including Austria and Greece, and should exceed the nominal level of debt of the Netherlands in 2024. Moreover, to issue such a large amount of EU debt efficiently, the European Commission quickly built a comprehensive borrowing strategy, based on the best practices of major EU issuers, using a mixture of syndicated transactions and auctions, and relying on a large primary dealer network 6 See Christie et al (2021) for a detailed explanation of the EU borrowing strategy, its primary dealer network and the differences between syndicated transactions and auctions. (details on the number, the average size of issuances and the coverage ratio of each type of operation can be found in Table A1 in the annex).
Figure 1: Issuance and outstanding debt of the EU (in € billions)

Source: Bruegel based on Bloomberg and European Commission. Note: Data as of 30 April 2023; EU debt includes debt securities issued to finance the MFA, BoP, EFSM, NGEU, and SURE programmes.
Beyond the scale of the borrowing, the two programmes differ in terms of their purpose and their impact on the EU budget. SURE loans were issued on a back-to-back basis, meaning that the responsibility for servicing this debt and for paying the interest rate costs falls on each of the 19 countries that requested this support. For NGEU loans, while the debt is guaranteed by the EU budget, including through an increase in the own-resources ceiling 7 EU countries agreed in 2020 to increase the EU’s debt guarantees via an added 0.6% of EU gross national income (GNI) in callable headroom (see Christie et al, 2021 for details on the functioning of the guarantee) , the costs associated with the debt are also borne by the countries in question. But, for NGEU, that leaves €421.1 billion in so-called ‘non-repayable support’ in the form of RRF grants and additional financing of EU programmes. The cost of repaying the borrowing related to these expenditures and the associated interest costs will be serviced through the EU budget. Given the large amounts that will need to be repaid, repayment will either be done through the creation of new EU budget resources, or as a last resort through an increase in member states’ contributions to the budget (using the increase in the callable headroom) 8 Council Decision 2020/2053, available at https://eur-lex.europa.eu/legal-content/EN/TXT/PDF/?uri=CELEX:32020D2053. .
At the same time as these fundamental developments in the establishment of a more sophisticated EU borrowing toolbox have been taking place, inflation has returned globally after years of below-target inflation, and interest rates have risen sharply after a period of historically low rates in advanced economies. Inflation increased up to double digits for the first time in four decades in response to a combination of supply-side bottlenecks caused by the on-going COVID-19 pandemic, the quick reopening of the euro-area economy in 2021 and a major hike in energy prices in the wake of Russia’s invasion of Ukraine.
Given the scale of the EU borrowing and the fact that the increase in interest rates was not expected when these programmes were launched, it is crucial to examine how the cost of the EU debt has changed. This policy brief also examines more specifically what the main drivers are behind the recent evolution of EU yields, and estimates what the interest costs borne directly by the EU budget could amount to until the end of the 2021-27 MFF, given today’s level of interest rates and current market expectations on how rates might evolve in the next four years. We conclude with policy recommendations that could help reduce the cost of EU borrowing.
2. Borrowing cost developments since the start of EU large-scale debt operations
When the EU started large-scale borrowing operations, in 2020 for SURE and 2021 for NGEU, interest rates in Europe and in other advanced economies were at historic lows, having been on a downward trend for several decades (Figure 7) 9 For explanations on the fall in the level of interest rates in the decades before COVID-19, see Zettelmeyer et al (2023). . As a result, until the beginning of 2022, the EU borrowed at very favourable rates across all maturities – even at negative rates for maturities below 10 years (Figure 2 and 3). Moreover, at the time, markets expected rates to remain relatively low in the foreseeable future, meaning that when the Commission estimated what borrowing costs would amount to for the whole 2021-27 MFF, they expected a cumulative interest cost of only €14.9 billion up to 2027 10 Source: https://commission.europa.eu/system/files/2021-01/mff_2021-2027_breakdo…. .
However, interest rates began to rise sharply in 2022. For instance, 10-year yields on EU bonds increased from negative levels to more than 3 percent in less than a year (Figure 2 Panel A). Furthermore, and more interestingly, EU yields, which had been between German and French yields for most maturities until February 2022 (Figure 2 Panel A and B), started to exceed French yields after Russia’s invasion of Ukraine. As of April 2023, the EU yield curve was significantly above the French , and also near or even above the Spanish yield curve for maturities up to 2 years, despite the EU enjoying a much better rating than France or Spain (median ratings of AAA, AA and A-, respectively; see Table A2 in the annex).
Figure 2: Evolution of yields for the EU, France, Germany and Spain (in %)
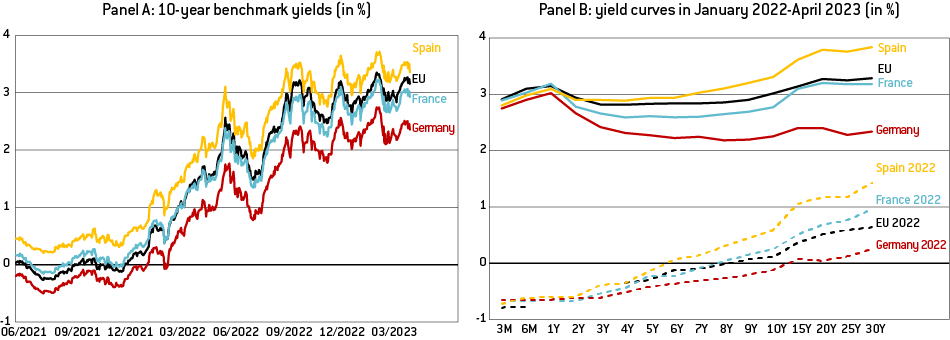
Source: Bruegel based on Bloomberg. Notes: dashed lines represent data as of 3 January 2022 while unbroken lines represent data as of 11 April 2023. For January 2022, the EU yield curve was incomplete so the values for the 1- and 3-year maturity yields are extrapolated.
Thus, two key drivers account for the substantial rise in EU yields in 2022: first, the rapid increase in all euro-denominated short-term rates in 2022 because of the European Central Bank’s monetary tightening, and second, and more interestingly, the notable increase in the spread between EU yields and German (and French) yields.
2.1 Monetary policy tightening by the ECB to tame above-target inflation
The strongest (and most obvious) driver behind the sharp increase in EU yields during 2022 was the tightening of ECB monetary policy to tame inflation. The ECB ended its net asset purchases in the first half of 2022 and then started hiking its policy rates in July 2022. The increase in the ECB’s deposit facility rate, its main policy rate to steer short-term market rates, by 375 basis points (bps) from -0.5 percent to 3.25 percent (Figure 3) at the time of writing, represents the first round of hikes since 2011 and the sharpest cumulative increase since ECB monetary policy began to be implemented in 1999. Logically, as soon as the market started to expect monetary tightening by the ECB, EU yields of all maturities, like all other euro-denominated rates, started increasing quickly (Figure 3).
Figure 3: EU rates across maturities and ECB main policy rate (in %)
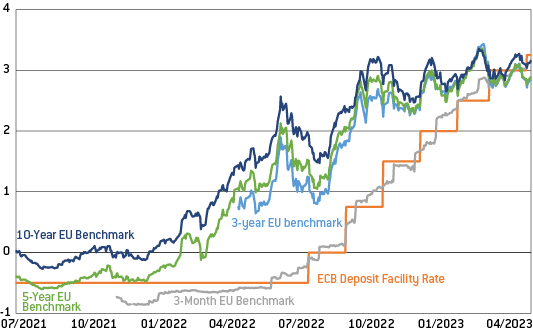
Source: Bruegel based on Bloomberg. Note: changes in the ECB Deposit Facility Rate as of announcement date.
While few observers foresaw such a resurgence in inflation and such a sharp monetary tightening after the COVID-19 crisis, the increase in EU yields as a result of the ECB’s monetary tightening is not inherently surprising (Claeys, 2023). Medium- and long-term rates are mainly determined by the expected path of short-term rates over the life of the asset, plus a term premium for holding long-term debt instead of rolling over short-term debt across the entire period. Bond yields therefore fluctuate with the business cycle and with central banks’ policy-rate movements. EU bond yields are no exception.
However, in the case of EU bonds this is not the end, nor even the most interesting aspect. The general increase in euro-denominated rates may be the main driver quantitatively behind the recent surge in EU yields, but it does not explain why EU yields have been increasing more than some European government yields, such as those of Germany, France or even Spain.
2.2 Higher spreads versus key European government bonds
The most remarkable development as far as EU bond yields are concerned in 2022 was the increase in the spread between EU and German yields for all maturities (Figure 2 Panel B). For instance, the spread – ie the difference – between the 10-year EU yield and the German yield, which had been stable around 20 bps throughout 2021, rose sharply (especially after Russia’s invasion of Ukraine) to reach a level above 80 bps in October 2022. It then fell back towards 60bps, before increasing again when the spring 2023 banking turmoil started, first in the United States, with the failure of Silicon Valley Bank, and then in Switzerland with Crédit Suisse (black line in Figure 6, panel A).
3. Potential explanations for the widening of the spread in 2022
What factors underlie this rise in the spread between German yields and EU yields? Providing a definitive answer is challenging because various factors likely contributed simultaneously, making it difficult to disentangle their individual effects. In addition, some of these factors are difficult to quantify and even sometimes to substantiate using publicly available data.
We therefore interviewed a broad range of stakeholders that engage with EU debt on a regular basis and represent diverse perspectives, including traders, fixed-income strategists from leading European banks, asset managers, experts from central counterparty clearing houses (CCPs), national Treasury officials and debt-management office (DMO) officials from EU countries and European institutions. The potential reasons behind the divergence in EU yields that we have compiled through these discussions can be grouped – albeit somewhat arbitrarily, as they are all ultimately interconnected – into three main types of explanation: 1) market features, 2) circumstantial factors, and 3) institutional features.
3.1 Market features: remaining differences between EU and major European government bonds
Even though EU bonds have changed radically in nature and in magnitude with the establishment of SURE and NGEU, there are still major differences compared to European government bonds, in particular with those, such as German or French bonds, that play a benchmark role in European financial markets. This makes EU bonds imperfect substitutes for government bonds at this stage.
A key distinction between EU and these government bonds is their liquidity, which refers to the ease with which they can be exchanged for cash. In general, investors prefer assets that can be resold quickly and easily, and are willing to pay a premium for such liquidity. This is particularly true in a market environment characterised by rising rates and volatility, such as currently, and during times of high stress or uncertainty, such as during the geopolitical and banking turmoil episodes that have occurred in the last 18 months. In such situations, investors may need to sell their assets quickly, making liquidity an especially valuable attribute.
Figure 4: Liquidity of EU, German, French and Spanish bonds
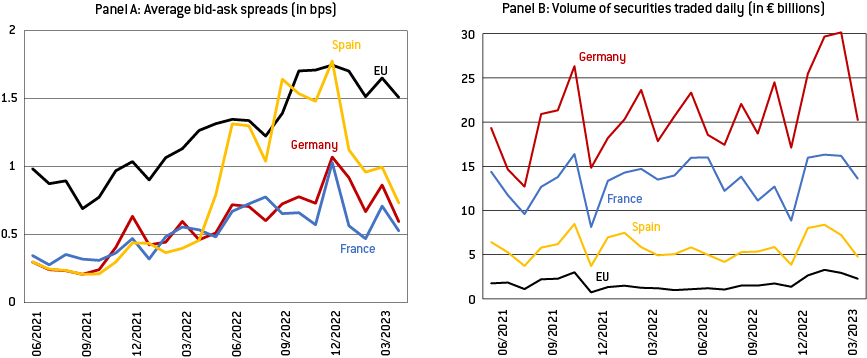
Source: Bruegel based on Bloomberg. Notes: Panel A: Monthly average of bid-ask spreads for 10-year bonds for selected issuers in basis points. Panel B: Monthly average of daily volume of security trades by issuer in € billions.
At this stage, the liquidity of EU bonds is much lower than the liquidity of other major European issuers. A good measure of liquidity is the bid-ask spread – ie the difference between the highest price a buyer is willing to pay for an asset and the lowest price a seller is willing to accept, at a given point in time. Over the last two years, the average bid-ask spread on EU bonds has been twice as high as those on French and German bonds, and most of the time higher than for Spanish bonds, indicating much lower liquidity of EU bonds (Figure 4, panel A).
Even if the EU is now considered as a large and frequent issuer that competes with major issuers in the primary market, the amount of EU debt traded daily in the secondary market is still much smaller than the debt of other major European issuers (Figure 4, panel B). This is logical given that the EU’s total outstanding debt is still much smaller (eg around €400 billion for the EU vs €2.3 trillion for France; see Table A2 in the annex for other comparable issuers). Moreover, the EU yield curve is still very much in construction: even if the EU is now active along the whole curve up to 30 years (Figure 5, panel A), the outstanding amount of bonds at each point still represents only a small share of Germany or France (Figure 5, panel B). Having a full curve with a significant number of trades at each point helps to boost arbitrage trades and thus overall liquidity.
If liquidity plays a crucial role in the appeal of a particular security, other market features are also seen as highly desirable by investors. Considered crucial by investors is the possibility to post a security as collateral to obtain cash easily and at minimal haircuts. On that front again, EU bonds do not fare well compared to major European issuers. The announcement by the ECB on 20 December 2022 11 See ECB press release, ‘ECB reviews its risk control framework for credit operations’, available at: https://www.ecb.europa.eu/press/pr/date/2022/html/ecb.pr221220_1~ca6ca2…. that it will accept EU bonds as collateral in its monetary operations, with the same haircut as similarly rated sovereigns, starting 29 June 2023, constitutes a milestone for the EU and sends a strong signal to market participants (and also shows the support from another influential EU institution). However, in central counterparty clearing houses (CCPs), which are increasingly used to centralise financial transactions, in particular repo operations, eligibility as collateral and the haircuts applied are still different for the EU compared to European government bonds. Haircuts applied to EU bonds by the most important CCPs (LCH, Eurex Clearing, Ice Clear Europe and Euroclear) are much higher than those applied to Germany and France (see the example for a 10-year bond in Table A2 in the annex). Most CCPs have their own risk management frameworks and do not rely on the ECB risk management framework, and are thus not expected to automatically follow the ECB in June. In any case, the use of EU bonds as collateral in CCPs remains negligible, especially compared to the use of German and French bonds (see the numbers for collateral in repo operations in Table A2).
Figure 5: Bond issuance by the EU, France and Germany
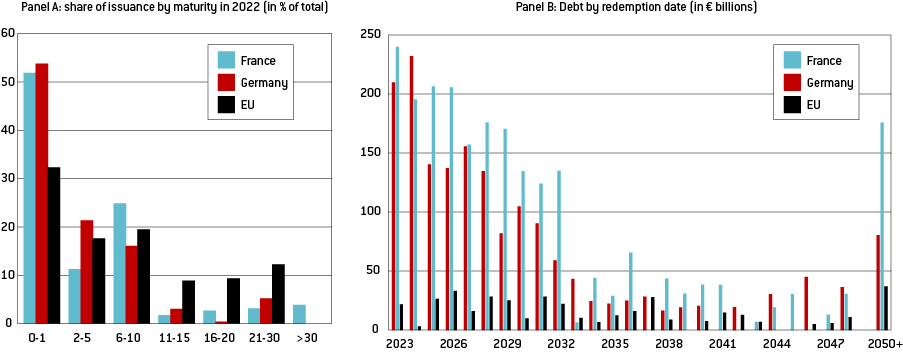
Source: Bruegel based on Bloomberg, European Commission, Agence France Trésor and Deutsche Finanzagentur. Notes: Panel A: Issuance in 2022 by maturity (in % of total issuance) Panel B: Scheduled redemptions of outstanding debt.
More generally, though EU bonds are subject to the same favourable regulatory treatment as the highest-rated European government bonds 12 They are considered as a Level 1 High-quality liquid assets in Liquidity Cover Ratio calculations and in capital requirements with 0% risk weight for banks under the Basel III framework and no capital charge in solvency requirements for insurance companies in Solvency II. , financial institutions still treat them differently in practice. For instance, in the internal risk models of financial institutions, EU bonds are sometimes considered riskier and are assigned higher risk weights because of their relative lack of history compared to government bonds. Additionally, EU bonds are often traded on a separate desk from government bonds – the SSA desk –, with much smaller trading and exposure limits, which further reduces their liquidity.
The appeal of a bond can also be enhanced by its inclusion in a specific bond index. These indices, initially created to measure the performance of the aggregate or of a specific segment of the market, have become increasingly relevant as passive investors rely on them to construct their portfolios 13 Passive investing refers to a buy-and-hold portfolio strategy for long-term investment horizons, with minimal trading in the market. Index investing is the most common form of passive investing, whereby investors seek to replicate and hold a broad market index or indices. . As EU bonds are not currently part of the most widely used sovereign bond indices 14 The most widely used indices are S&P Dow Jones Indices, Bloomberg Fixed Income indices, ICE Fixed Income Indices, FTSE Russell, MSCI and JP Morgan (Eichert and Tanguy, 2023a) – currently composed only of central government bonds issued in own currencies (Eichert and Tanguy, 2023a) – they have access to a smaller and less-diversified investor base 15 See the difference in investor base in Figure A2 in the annex. . This is particularly significant given the growing importance of passive investing in recent years.
Other characteristics of EU bonds also hinder their popularity and contribute to the interest rate premium paid by the EU compared to Germany. These characteristics include the absence of a repo facility managed by the EU like that managed by the German DMO to enhance liquidity and avoid temporary scarcity episodes; the absence of futures on EU bonds (which boost trading and liquidity by giving traders some material to build trades); the minimal presence of EU bonds quoted on electronic platforms; and the fragmentation of bonds between the various EU programmes (NGEU, SURE, Green NGEU, MFA, BoP, EFSM), which also reduces the overall liquidity of EU bonds.
The European Commission is aware of these issues and has launched various initiatives to deal with them. To reduce fragmentation between different programmes, the EU moved to a unified funding strategy in January 2023 16 Council Regulation (EU, Euratom) 2020/2093 of 17 December 2020 laying down the multiannual financial framework for the years 2021 to 2027’, available at: https://eur-lex.europa.eu/legal-content/EN/TXT/?uri=uriserv%3AOJ.LI.202…. . This means that all the different programmes supported by EU borrowing will be financed with standardised EU bonds instead of different programme bonds (even if some diversity of bonds will remain, with Green NGEU bonds and SURE social bonds). Such a unified strategy, which will also allow the EU to use more tapping of existing bonds, should help increase the liquidity of its debt (Bletzinger et al, 2022), something also highlighted by investors in a survey on EU bonds (Eichert et al, 2022). When the Commission announced the launch of its unified funding strategy, it also announced other initiatives: work on establishing a repo facility for 2024 to boost liquidity, and the putting in place of a price-quoting commitment for its primary dealers, which should be in place in summer 2023 (see also Table A2 for details on primary dealer obligations) 17 Source: https://ec.europa.eu/newsroom/budget/items/770837/en. .
A last substantial difference between the EU and countries including Germany, France and Spain, is issuance strategy. The EU relies massively more than these countries on syndications than on auctions for its debt issuance: syndicated transactions represented half of the EU debt issued in 2022, while for Germany, France and Spain they only accounted for 4 percent, 2 percent and 13 percent respectively (Table A2) 18 These numbers include the auctions of short-term bills. Without them, the share of syndications would be even higher at 69%. . It is understandable that, as a new major issuer that needed to establish itself on the market and to build a diverse and stable investor base almost from scratch, the EU preferred to ensure large demand for its debt and to highlight the oversubscription in its first borrowing operations, rather than to minimise costs. Ensuring demand is probably easier to do through syndications with the help of major European banks. However, the much higher level of oversubscription in syndications compared to auctions 19 The cover ratio is 9.6 for syndications and 1.9 for auctions, see Table A2. – in which the bargaining power of investors is less – might suggest that the European Commission is selling its bonds too cheaply (ie conversely at a too-high yield).
In theory, all these market features of EU bonds should help explain the level of the spread between EU and German yields. But in theory structural factors shouldn’t explain its recent increase (unless some of these features have become more important for investors in recent months, which might be the case, as seen for liquidity at the beginning of this section). However, when bond prices start diverging (as they did in 2022), these differences act as frictions that reduce the substitutability of EU bonds and European government bonds, hindering arbitrage opportunities and thus impeding the self-correction that would result in a narrowing of the spread.
Finally, to explain the specific evolution of EU yields since the start of 2022, it is also crucial to understand one last market feature: how EU bonds are priced in financial markets. One reason why EU yields diverged in 2022 was that market participants price EU bonds and sovereign bonds differently. Like the debt securities of other entities considered as Supranationals, Subnationals and Agencies (SSAs), EU bonds are mainly valued in comparison with swaps 20 A swap is a financial contract in which two parties exchange an annual fixed payment for a specified period, in return for a floating short-term rate. The fixed rates for various maturities are used to construct the swap curve. The swap most often used in this case for euro denominated assets is the swap against the six-month Euribor. , while European government bonds are generally priced in comparison with German bonds (also called Bunds).
SSAs are traditionally priced against swaps instead of Bunds for several reasons. This generally reflects the increasing role of the swap curve as a benchmark in financial markets, given its large market size and frequent use in hedging and positioning activity 21 See details on the swap market and its benchmark role in Remolona and Wooldridge (2003), Kreicher et al (2017) and Dalla Fontana et al. (2019). . But more specifically, in the SSA market, some issuers – mostly public and multilateral development banks – often employ swaps to manage the interest rate risk that arises from the mismatch between the maturities of their liabilities and assets. The spread with swaps is thus a significant factor in their cost calculations. Consequently, traders have adopted the practice of using the swap curve as a benchmark in their pricing models to value the bonds of SSAs, including the EU ones. Whatever the reason behind this market convention, the result is that the EU yield curve is much more correlated with the swap curve than with the German one (Figure 6, panel A). This means that the EU-German spread can be conveniently decomposed into an EU-swap spread and a swap-German spread.
Figure 6: Spreads vs Germany and market stress
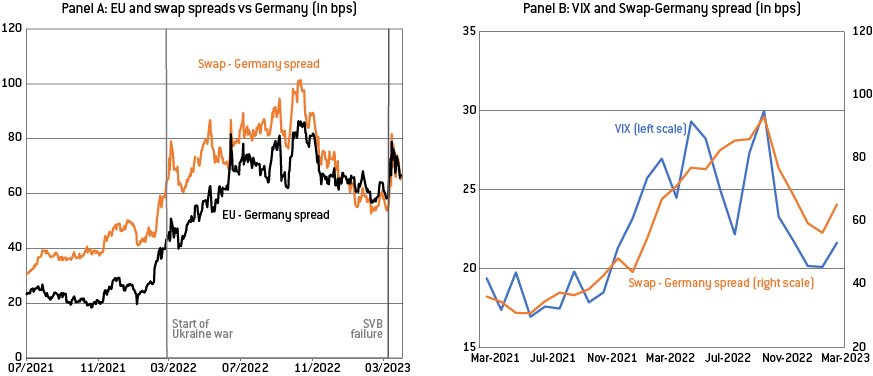
Source: Bruegel based on Bloomberg. Notes: Panel A: 10-year spreads between EU yields and German yields and between swap rates and German yields (in bps). See explanation of what a swap is in footnote 18. The first vertical line is 24 February 2022, the date of Russia’s invasion of Ukraine. The second vertical line is 10 March 2023, when Silicon Valley Bank was put into receivership. Panel B: Monthly average of the VIX index and the German Bund-Swap spread (in bps). The VIX Index is a measure of 30-day expected volatility of the US stock market, derived from mid-quote prices of S&P 500 call and put options. It is one of the most recognised measures of volatility, widely reported by financial media and followed by market participants.
3.2 Circumstantial explanations
One major reason behind the increase in the EU-German spread is that, since the start of 2022, swaps and German yields have faced two opposite dynamics.
German yields have increased relatively less than other euro-denominated interest rates, and especially to swaps, because they have benefitted from an increase in risk aversion (see for example the strong correlation between the VIX index, which measures expected volatility in financial markets, and the German-swap spread visible in Figure 6, panel B). Such a flight to quality/liquidity towards German bonds is to be expected during high stress episodes such as the war in Ukraine or the banking turmoil that started with the failure of Silicon Valley Bank (which are both visible in Figure 6).
In addition, the substantial increase in collateral needs resulting from the general increase in volatility in financial markets, and the sizable margin calls 22 A margin call is a demand from a brokerage house to a customer that more money or securities be deposited in their account when the amount in it falls below what is stipulated as necessary to covers financial transactions. linked to surging energy prices in the spring and summer of 2022 23 As noted by the European Systemic Risk Board in a 20 March 2023 letter (https://www.esrb.europa.eu/pub/pdf/other/esrb.letter230320_on_emir_revi…). See also Gillian Tett, ‘Brussels ignores derivatives at its peril amid energy crisis’, Financial Times, 8 September 2022, https://www.ft.com/content/b58480fb-b9de-4316-af21-b82167ef3e20. There is plenty of anecdotal evidence supporting this, but not much public data available, as CCPs do not share this data publicly. , contributed to the high demand for German bonds, exacerbating their already significant scarcity, which resulted from years of ECB quantitative easing. Actually, the peak in the spread between Bunds and swaps/EU yields coincided with the period when concerns about collateral scarcity were most pronounced – October 2022. However, measures taken subsequently by the Deutsche Finanzagentur and the ECB to alleviate collateral scarcity (ICMA, 2023) coincided with a narrowing of the spreads at the end of 2022 and beginning of 2023 (Figure 6, panel A).
On the other hand, swap rates increased more quickly than European government bonds in 2022 because of the high demand for these financial products from financial institutions that needed to hedge against the interest-rate risk resulting from the unexpected general rate increase. These two opposite developments led mechanically to an increase in the Bund-swap spread, which, given the benchmark role swap rates play for EU yields, led to in an increase in the Bund-EU spread too.
The end of ECB net asset purchases in the first half of 2022 also acted as a circumstantial driver that contributed to the increase in the spread (Bonfanti and Garicano, 2022). Until then, the bond market was more favourable to borrowers, but with the gradual withdrawal of the ECB as a large buyer, the market shifted to being dominated by lenders. As a result, the spreads versus swaps for all issuers priced against euro-denominated swaps (such as the EIB, the German KfW, the French UNEDIC and CADES, and the EU) experienced a general increase, moving from negative to slightly positive. This shift may have been amplified by the fact that the ECB faced fewer constraints when purchasing supranational bonds, such as EU bonds, as the issuer limit was set at 50 percent, than when buying euro-area government bonds, with a 33 percent limit. Since the ECB was buying a higher proportion of recently issued bonds, it had a greater positive impact on their price than on the price of government bonds. This effect vanished when the ECB halted net purchases (or more precisely when markets started anticipating their end, around the end of 2021), which further contributed to the overall spread increase.
Furthermore, this situation coincided with a time when there was an abundant supply of EU bonds, making it even more challenging for investors to absorb them compared to other SSAs. Consequently, the swap spread increased by a few basis points more for the EU compared to other issuers. However, the impact of the end of the ECB’s purchases is not clear cut 24 It is also impossible to measure precisely this effect given that the ECB does not release the detailed data on its purchases of supranational bonds. , as the higher volume of EU bonds available to market participants should also enhance their liquidity, potentially also partly reducing the yield premium paid by the EU for its lower liquidity.
3.3 Institutional features: the EU is still conceptually very different from sovereign issuers
Some of the elements discussed in sections 3.1 and 3.2 already hint at the fact that institutional factors play a crucial role in explaining why borrowing costs are higher for the EU than for Germany (or France). The EU’s non-inclusion in sovereign bond indices, its different treatment by CCPs, and the fact that the EU is considered as an SSA and therefore evolves in a different market in which the main benchmark is the swap and not the Bund, highlight that EU bonds are different from sovereign bonds. The fact that EU yields moved with swaps, and thus rose more quickly than Bund yields during stress episodes, shows that EU debt securities, despite their very high rating, do not have yet the essential property of safe assets, which is to credibly store value at all times, especially during crises (Caballero et al, 2017).
Most rating agencies consider that the guarantee for the EU’s debt provided by the own resources ceiling and its increase in 2020 is in practice equivalent to joint and several liability, meaning that each country should be liable to repay the debt both individually and jointly, which underpins its high ratings 25 At time of writing, Fitch, Moody’s and DBRS rate the EU’s debt as AAA, while Standard and Poor’s rates the EU’s debt as AA+. . However, some have interpreted the widening of the spread with Germany in 2022 as a possible signal that market participants are starting to doubt the legal framework underpinning the EU’s debt 26 Moritz Kraemer, ‘EU bonds have not lived up to high expectations’, Financial Times, 18 April 2023, https://www.ft.com/content/dc82d584-4961-4af3-ab32-eb504bb3e375. (Kraemer, 2023). This interpretation is probably vastly exaggerated given that European Stability Mechanism, European Investment Bank and even KfW yields have evolved similarly to the EU’s, even though they benefit from very different types of guarantee (supported by paid-in and callable capital in the ESM and EIB cases, and guaranteed directly by the Federal Republic of Germany in the KfW case).
Nevertheless, it is undeniable that most investors still perceive the EU as an “inbetweener”, ie a hybrid issuer between an SSA and a sovereign (Eichert et al, 2022). This view is justified by three main institutional features of EU debt.
First, the EU is not supposed to be a permanent player in the bond market. The legal framework of the EU recovery instrument states that the net issuance of EU bonds should conclude at the end of 2026. Thereafter, there should only be a partial roll-over of the debt to reduce it gradually until it is fully extinguished in 2058. This will reduce drastically the liquidity in the EU bond market after 2026, and thus reduces already today the appeal of the bonds, because they cannot be part of long-term investment strategy/portfolio (Eichert et al, 2022). Moreover, the development of a futures market would not be viable if the EU is not present in a consistent way with a steady stream of issuance, and if liquidity falls after 2026.
Second, even though the EU has some features of a sovereign, with a legislative branch and a judicial branch, it misses a key feature of the usual definition of sovereignty which is taxation power. Even if the EU can access indirectly member states’ resources through GNI-based contributions to the EU budget, it also signals to markets that the EU is fully reliant for its financing on its members and difficult negotiations between them, and is thus different from a sovereign that can resort to taxation very easily and quickly. This is probably one of the main reasons why the EU does not fulfil the criteria to be included in the main sovereign bond indices (Eichert and Tanguy, 2023a).
Third, the supranational nature of the EU has the consequence that the EU does not have a natural domestic buyer base to tap into (which is often prevalent during stress times, for better or for worse). European banks are still predominantly national and still exhibit a very strong domestic bias in their asset holdings (Beck et al, 2022). Only a real internationalisation of banks at the European level, probably driven by the completion of the banking union, could help on that front.
These institutional elements could explain why EU borrowing costs are higher than those of Germany (despite a similar rating) or France (despite a higher rating). But why did this spread increase in 2022, then? Even though the temporary nature of the EU borrowing was written in stone from the launch of the large-scale EU borrowing initiative, it seems that markets were initially convinced of the ‘Hamiltonian moment’ 27 ‘Hamiltonian moment’ refers to the United States’s first Treasury Secretary, Alexander Hamilton, who consolidated the war debt of the thirteen colonies with the issuance of common debt. nature of the EU’s 2020 decision to borrow together to finance the COVID-19 recovery package, and believed that the recovery fund, in some way or another, and the bond issuance associated with it, would quickly become permanent.
However, during 2022, markets received clear and repeated signals from some EU countries that they were serious about the fact that they saw the massive EU borrowing only as a one-off response to a once-in-a-century shock. Even though the idea to build another NGEU-like tool – first to deal with the energy crisis and later to respond to the US Inflation Reduction Act – floated around for the whole of 2022, the idea has not materialised.
Furthermore, the German Constitutional Court, in a December 2022 judgment on the legality of NGEU 28 The judgement is available in English at https://www.bundesverfassungsgericht.de/SharedDocs/Entscheidungen/EN/20…. adopted a very narrow reading of the NGEU architecture, emphasising its temporary and exceptional character. All of this led markets to adjust their expectations about the permanence of the EU presence in the bond market. The increase in spread in 2022 can then be seen as a lengthy price discovery, as the limited life of NGEU became more tangible to market participants. In addition, the absence of progress in 2022 on new own resources for the EU budget, despite a proposal made by the Commission at the end of 2021 29 See European Commission press release of 22 December 2021, https://ec.europa.eu/commission/presscorner/detail/en/ip_21_7025. , probably helped to convince markets that EU borrowing would not be permanent. the share of investors considering the EU only as an SSA and not even as ‘an 'inbetweener’ increased by 10 percentage points between November 2021 and November 2022 (Eichert et al, 2022). These various developments on the institutional front probably played a significant role in the spread widening in 2022.
4. Projected borrowing costs borne by the EU budget in the coming years
As noted, the EU will borrow a total of €421.1 billion, in current prices, for ‘non-repayable support’ (ie for RRF grants and additional financing of EU programmes) before the end of 2026. The interest costs associated with this borrowing will be serviced through the EU budget 30 The interest costs on the remainder of the EU debt (incurred for SURE and NGEU loans) will be borne directly by the EU countries that have requested these loans. . It is therefore crucial to estimate how these costs could evolve until the end of the 2021-27 MFF.
This estimate will depend on the evolution of interest rates in the coming years. At this stage, market participants’ median expectation is for rates to stay at around their current level for the next few years. Investors expect the 10-year euro swap rate – a good proxy for the EU yields, as we have discussed (+/- a small spread, eg of around 10bps on average on 10-year rates) – to fall only slightly towards 2.8 percent by 2026 (Figure 7). One way to quantify uncertainty around this baseline projection is to derive probabilities of different scenarios from swap option prices. This approach suggests that uncertainty about the level of nominal interest rates in the euro area is very high, even at the 3-year horizon. With a 50 percent probability, investors expect it to be in the 1.9 percent to 3.7 percent range in 2026, while the 90 percent probability interval ranges from 0.1 percent to 6.2 percent (Figure 7).
Figure 7: 10-year swap rate, expected rate and option-implied confidence intervals (in %)
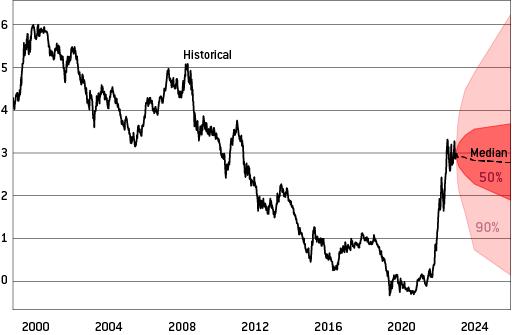
Source: Bruegel based on Danske Bank and Bloomberg. Notes: The chart displays historical and possible future values of the 10-year euro swap rate. The 10-year euro swap rate reflects market expectations of the average short-term rate over the next 10 years and can thus be interpreted as a good proxy for the 10-year EU yields. Dark and light red shaded areas correspond to the 50 and 90 percent confidence intervals, respectively, as defined by risk-neutral probabilities derived from the option prices on 10-year-swap rates.
How does this translate into actual EU interest costs? We can make projections of annual interest costs that will be serviced by the EU by combining data on the EU’s current debt stock with estimates of future financing needs, the maturity structure of current debt, market expectations for the level and volatility of future interest rates, and average spreads between swaps and EU yields 31 See the annex for details about the methodology, data sources used and assumptions made to obtain these estimates. .
The results (Figure 8) suggest that it is highly probable that the interest costs on EU debt borne by the EU budget will be much higher than what the European Commission forecasted at the beginning of the MFF in 2021 (the blue line with triangle markers in Figure 8). While the Commission’s initial forecasts envisaged annual interest costs increasing slowly towards around €5 billion in 2027 (and overall costs for the whole MFF to be around €15 billion), costs could be twice as large in our baseline scenario, reaching €9.9 billion in 2027 (while total costs would amount to €30 billion, see bold numbers on the right side of Figure 8). As a result, interest costs will represent a significant part of the EU budget: around 5.3 percent of the 2027 annual budget, and 2.5 percent of the whole MFF 2021-27 (Figure A2 in the annex). However, again, given the high uncertainty surrounding the level of interest rates in the coming years (represented by the large confidence intervals in Figure 7), costs could vary considerably around our baseline estimate: with 50 percent probability, interest costs should be in the €7.8 billion to €12.4 billion range in 2027, while the 90 percent probability interval ranges from 3.2 billion to €18.1 billion, as shown in Figure 8 (see Figure A2 for what these represent as a share of the EU budget).
Figure 8: Projected annual and total interest costs borne by the EU (in € billions)
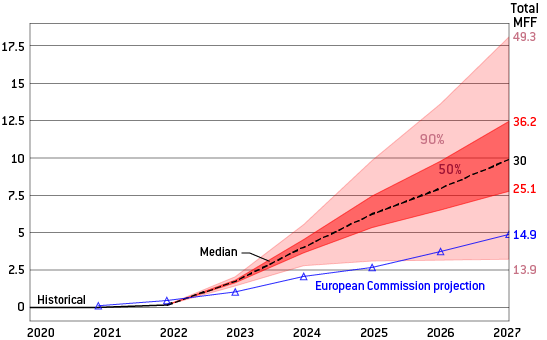
Source: Bruegel based on Danske Bank, Bloomberg and European Commission. Notes: The chart presents historical and projected annual interest rate costs (lines, LHS) and total costs (numbers in bold, RHS) borne by the EU, in current prices. 50 and 90 percent confidence intervals are based on option implied interest rate volatilities (see notes to Figure 6 and methodology detailed in the annex). The blue line with triangle markers displays the European Commission’s projections from 2021 (https://commission.europa.eu/system/files/2021-01/mff_2021-2027_breakdown_current_prices.pdf).
How should the EU deal with the significant uncertainty around its interest costs? As discussed, it is normal for rates and thus interest costs to fluctuate with the business cycle. The EU will thus need to learn to live with this and optimise its debt issuance strategy – for instance in terms of maturity structure to lock in low rates when they are available – in order to minimise interest costs, as sovereigns do. However, in practice, the EU should also change how interest costs are accounted for in the EU budget.
Given the current inflexible way in which the MFF and EU budget are constructed (they are not designed for expenditures that can fluctuate endogenously), a much higher level of interest costs than the initially planned €14.9 billion will quickly exert pressure on some important EU budget programmes in the coming years. This is because interest costs will compete with other expenditures (European Parliament, 2022, paragraphs 10 and 31-33).
It is true that the significant surge in inflation is resulting in a substantial increase in the gross national income (GNI) of EU countries. Consequently, there will be a noteworthy rise in the ‘own resources ceiling’, enhancing the guarantee on EU debt provided by EU countries. In nominal terms, the EU can call on higher contributions from member states if necessary to repay its debt or pay interest. Thus, there is no concern about the EU defaulting on its financial commitments. However, the inflation surge does not increase the ‘expenditure ceilings’, which are capped at 2018 prices plus a fixed annual growth rate of 2 percent to account for inflation (Council Regulation 2020/2093, Article 4.2). This means that a large increase in interest payments – as we project – could quickly exhaust funds at the expense of EU programmes under the same expenditure category, or ‘heading’ in EU budget jargon (for example, Erasmus+ or the European Social Fund+) 32 This issue comes on top of the more general problem that in real terms the EU budget is already reduced because inflation has been much higher than the 2% level used every year to transform agreed amounts in 2018 prices into current prices. .
5. Policy recommendations and concluding remarks
Circumstances drove the increase in EU yields in 2022. First, the surge in inflation led to the sharpest monetary tightening since the creation of the ECB, and second, a divergence between euro-denominated swaps and German bunds led to a stronger increase in EU yields than in European government bond yields because EU yields are more correlated with swaps than with German yields. As far as the first circumstance is concerned, the EU cannot do anything about it and will have to learn to live with the cyclical nature of interest-rate movements. However, the second circumstance is more problematic as it shows that the EU is not yet accepted fully as a provider of safe assets. Even if the German-swap spread declines to its 2021 level, because temporary drivers of the divergence fade, and bring back EU yields lower, the underlying problem would persist and could come back during future stress episodes.
Therefore to reduce borrowing costs and bring back EU yields towards German yields in a permanent way, in order to reap the full benefits of EU borrowing (because if EU debt is more expensive than what countries can obtain by themselves, it will not be are attractive to them), the EU must convince markets that EU bonds should be traded in the same way as sovereigns 33 The convention of pricing EU bonds against swaps could evolve. It made sense for the EIB, ESM and other SSAs that have a balance sheet and need to manage their balance sheet risks with swaps, but this is not the case for the EU, which does not have a balance sheet nor exactly a lending book, and is already more like a sovereign in that regard, with cash flows coming from indirect taxation. .
Our main recommendations are:
- The European Commission’s issuance strategy can still be improved to reduce EU borrowing costs at the margin: the Commission should gradually increase the share of auctions and limit its usage of syndicated transactions to reduce the bargaining power of its primary dealers and obtain better prices for EU debt. At the very least, the Commission could be slightly more aggressive in terms of prices in its syndicated transactions. Moreover, to increase the liquidity of its bonds, the EU might also focus first on building a very liquid short-term end of the yield curve (to attract more trading), instead of scattering its issuances all over the yield curve, including in very long-term maturity.
- The European Commission should continue to work on building market infrastructures for EU bonds to increase their appeal for investors. There are already various worthwhile initiatives in the pipeline, announced in December 2022 when the Commission introduced its unified funding strategy (electronic quotes, repo facility, etc).In addition, the Commission should continue trying to convince CCPs to put haircuts at the same level as similarly-rated sovereign bonds and index providers to include EU bonds in sovereign bond indices.
This would increase drastically the EU’s investor base and the overall demand for EU bonds. The Commission should also try to develop a futures market which would increase the number of trades taking place and thus the liquidity of EU bonds. - However, to work, changes in market features will have to go hand-in-hand with some institutional development. To be considered as a sovereign, and to benefit from the safe-asset status of a highly rated sovereign, the EU probably needs sovereign features. The EU as an issuer is currently trapped between SSA and sovereign status. The spread widening of 2022 and results from investors’ surveys (Eichert et al, 2022) suggest that, after a strong start, the EU might be sliding back towards the SSA status. Technical market developments will thus not be enough (and might not even be possible if there is no institutional progress) to escape this trap. If EU countries want to reap the full benefits of EU borrowing, some political progress will have to take place. The discussion on the creation of new own resources to repay the EU debt scheduled for the autumn of 2023 will therefore be critical. The development of ‘direct taxing powers’ would help greatly from a symbolic perspective, as well as in practice, as it would be a great argument supporting inclusion in sovereign bond indices. As far as EU countries are concerned, it is counterproductive to repeat that EU debt is not permanent: at the minimum, EU borrowing should remain in the EU toolbox for future crises, but could also be beneficial in good times to serve other purposes, for instance to finance European public goods to help solve today’s most pressing challenges, including climate change, defence and R&D in clean tech.
- Finally, given the much higher interest costs than initially planned, the EU should quickly review how interest costs are accounted for in the EU budget and in the MFF, to ensure this does not exert undue pressure on important EU programmes. One solution – recommended by the European Parliament (2022) – would be to use the occasion of the mid-term revision of the MFF scheduled for 2023 to exclude the interest payments’ budget line from heading 2b, and to count it above the MFF expenditure ceilings. A second solution, while maybe not feasible in the immediate future, but which should be given serious consideration, is a comprehensive review and modernisation of the excessively intricate and outdated accounting framework of the EU budget 34 Darvas (2019) made a similar recommendation based on the fact that the accounting framework of the EU is not used by any other country or international institution. . Specifically, eliminating the possible inconsistency between own resources and expenditure ceilings should be prioritised, as the former grows in tandem with actual inflation while the latter grows at a fixed 2 percent trend. Finally, another, more ambitious, solution is (again) to quickly make some progress and find an agreement on genuine own resources that can be allocated, at least in part, towards debt repayment and interest expenses, as agreed in 2020 35 See the joint declaration by the European Parliament, Council and Commission on the treatment of NGEU interest costs and repayments in the 2021-2027 MFF: https://eur-lex.europa.eu/legal-content/EN/TXT/PDF/?uri=CELEX:32020C122…). .
Beck, T., J.-P. Krahnen, P. Martin, F. Mayer, J. Pisani-Ferry, T. Tröger, B. Weder di Mauro, N. Véron and J. Zettelmeyer (2022) ‘Completing Europe’s banking union: economic requirements and legal conditions’, Policy Contribution 20/2022, Bruegel, available at https://www.bruegel.org/policy-brief/completing-europes-banking-union-economic-requirements-and-legal-conditions-0
Bletzinger, T., W. Greif and B. Schwaab (2022) ‘Can EU bonds serve as euro-denominated safe assets?’ Working Paper Series 2712/August, European Central Bank, available at https://www.ecb.europa.eu/pub/pdf/scpwps/ecb.wp2712~6f023a5df2.mt.pdf
Bonfanti, G. and L. Garicano (2022) ‘Do financial markets consider European common debt a safe asset?’ Bruegel Blog, 8 December, available at https://www.bruegel.org/blog-post/do-financial-markets-consider-european-common-debt-safe-asset
Caballero, R., E. Farhi and P-.O. Gourinchas (2017) ‘The safe assets shortage conundrum’, Journal of Economic Perspectives 31(3): 29-46, available at https://pubs.aeaweb.org/doi/pdf/10.1257/jep.31.3.29
Christie, R., G. Claeys and P. Weil (2021) Next Generation EU borrowing: a first assessment, In-Depth Analysis prepared for the European Parliament’s Committee on Budgets (BUDG), available at https://www.europarl.europa.eu/thinktank/en/document/IPOL_IDA(2021)699811
Claeys, G. (2023) Finding the right balance (sheet): quantitative tightening in the euro area, Monetary Dialogue Papers, study prepared for the Economic and Monetary Affairs Committee (ECON) of the European Parliament, available at: https://www.europarl.europa.eu/cmsdata/267599/Final_CLAEYS.pdf
Dalla Fontana, S., M. Holz auf der Heide, L. Pelizzon and M. Scheicher (2019) ‘The anatomy of the euro area interest rate swap market’, Working Paper Series 2242/February, European Central Bank, available at https://www.ecb.europa.eu/pub/pdf/scpwps/ecb.wp2242~b1f459eb90.en.pdf
Darvas, Z. (2019) ‘Memo to the commissioner responsible for the European Union budget’, in M. Demertzis and G.B. Wolff (eds) Braver, greener, fairer: Memos to the EU leadership 2019-2024, Bruegel, available at https://www.bruegel.org/sites/default/files/wp_attachments/BRAVER-GREENER-FAIRER_Memos2019_1.pdf
Eichert, F., L. Harreau, and V. Tanguy (2022) ‘EU investor survey 3.0: stuck in transition’, SSA Focus, 16 November, Credit Agricole CIB, available at https://research.ca-cib.com/article/details/172e71e4-518c-4035-9433-bf125f0f11ec
Eichert, F. and V. Tanguy (2023a) ‘Impossible is nothing (but it will still be hard): EU pushing for inclusion in sovereign bond indices according to Reuters’, SSA Focus, 4 May, Credit Agricole CIB, available at https://research.ca-cib.com/article/details/ccd5c8ad-448c-451e-b743-618480496388
Eichert, F. and V. Tanguy (2023b) ‘NGEU disbursement tool’, SSA Focus, 14 April, Credit Agricole CIB, available at https://research.ca-cib.com/article/details/d667a04c-91bd-4931-85a6-968b66a0469f
European Commission (2021) ‘Semi-annual report on the execution of the NextGenerationEU funding operations pursuant to Article 12 of Commission Implementing Decision C(2021)2502’, COM(2022) 43 final, available at https://commission.europa.eu/system/files/2022-02/com_2022_43_1_en_act_part1_v6.pdf
European Commission (2022a) ‘Half-yearly report on the implementation of borrowing, debt management and related lending operations pursuant to Article 12 of Commission Implementing Decision C(2022)9700’, COM(2023) 93 final, available at https://commission.europa.eu/system/files/2023-02/COM_2023_93_F1_REPORT_FROM_COMMISSION_EN.PDF
European Commission (2022b) ‘Funding Plan January-June 2023’, 19 December, Publications Office of the European Union, available at https://commission.europa.eu/system/files/2022-12/Factsheet_Funding%20Plan_January-June%202023_19dec_1.pdf
European Parliament (2022) ‘Resolution on upscaling the 2021-2027 Multiannual Financial Framework: a resilient EU budget fit for new challenges’, 2022/2046 (INI), 15 December, available at https://www.europarl.europa.eu/doceo/document/TA-9-2022-0450_EN.pdf
ICMA (2023) ‘The European repo market at 2022 year-end’, ICMA European Repo and Collateral Council (ERCC) Briefing Note, International Capital Market Association, available at https://www.icmagroup.org/assets/ICMA-European-Repo-Market-2022-brochure-January-2023.pdf
Kreicher, L., R. McCauley and P. Wooldridge (2017) ‘The bond benchmark continues to tip to swaps’, BIS Quarterly Review, March, Bank for International Settlements, available at https://www.bis.org/publ/qtrpdf/r_qt1703h.pdf
Remolona, E. and P. Wooldridge (2003) ‘The euro interest rate swap market’, BIS Quarterly Review, March, Bank for International Settlements, available at https://www.bis.org/publ/qtrpdf/r_qt0303f.pdf
Zettelmeyer, J., G. Claeys, Z. Darvas, L. Welslau and S. Zenios (2023) ‘The longer-term fiscal challenges facing the European Union’, Policy Brief 10/2023, Bruegel, available at https://www.bruegel.org/policy-brief/longer-term-fiscal-challenges-facing-european-union
Methodology to derive projections of interest costs that will be borne by the EU
Projections of future interest costs that will be borne by the EU are calculated by combining data on the EU’s current debt stock with estimates of future financing needs, the original maturity structure of current debt and market expectations of future interest rates.
We use European Commission transaction data and press releases to identify historical interest costs for bills and for bonds that are attributed to NGEU, ie the only programme with non-repayable components. Since interest costs of some NGEU bonds are borne by EU countries, we adjust the size of historical coupon payments by the non-repayable share of allocated NGEU funds as reported in the European Commission’s reports on the implementation of borrowing, debt management and related lending operations (European Commission, 2021, 2022a). Because bonds issued under the unified funding strategy which started in January in 2023 are not assigned to specific programmes, we adjust the related coupon payments by the share of NGEU in total borrowing as put forward in the European Commission’s December 2022 Funding Plan (European Commission, 2022b), before correcting by the share of non-repayable financing in outstanding disbursements as of December 2022 (calculated based on European Commission, 2022a).
Outstanding borrowing needs in 2023 and borrowing needs for the subsequent years are based on estimates for outstanding disbursements of NGEU grants and rollover costs of existing and future debt. We assume equal disbursement of outstanding non-repayable programme support until the end of 2024 and equal disbursement of outstanding RRF grants until the end of 2026. Borrowing needs are met by taking up new debt according to the original maturity profile of the current debt stock. Interest rates are based on forward swap data for each projection year and respective maturities, corrected by the one-year average spread between euro swaps and generic EU bonds, from May 2022 to April 2023. We use forwards of 3 months, 6 months, as well as 1-, 2-, 3-, 4-, 5-, 10-, 15-, 20-, 25- and 30-year swaps, correcting each by the spread with respective EU generic bonds and linearly interpolating missing rates along the yield curve. Robustness checks for alternative borrowing scenarios based on projections for grant disbursements by Eichert and Tanguy (2023b) result in marginal increases in projected interest costs (baseline total interest costs amount to €32.4 billion, with a 50 percent range between €27.4 billion and €28.8 billion, and a 90 percent range between €15.8 billion and €52.2 billion).
50 percent and 90 percent confidence intervals are based on market expectations. Specifically, we use the implied volatilities of option prices for euro swaps of various maturities to derive upper and lower bounds for respective forward rates, and repeat the projection described above for each bound.
Table A1: EU borrowing from June 2020 to April 2023
|
Issuance type |
Number |
Average volume per issuance (in € billions) |
Average cover ratio |
|
Bill auctions |
72 |
1.317 |
2.2 |
|
NGEU bond syndications1 |
15 |
7.267 |
9.2 |
|
NGEU bond auctions1 |
11 |
2.486 |
1.7 |
|
NGEU green bond syndications |
5 |
7.0 |
10 |
|
NGEU green bond auctions |
4 |
1.862 |
1.8 |
|
SURE social bond syndications |
14 |
7.025 |
9 |
|
EU bond syndications2 |
5 |
5.0 |
11 |
|
EU bond auctions2 |
9 |
1.909 |
1.8 |
|
MFA syndications |
8 |
0.9 |
10.4 |
|
EFSM syndications |
3 |
3.983 |
9.1 |
Source: Bruegel based on European Commission. Note: (1) NGEU bonds refer to bonds issued between June 2021 and December 2022 explicitly for the purpose of financing NGEU payments. (2) EU bonds refer to bonds issued by the Commission under the unified funding strategy since January 2023. In instances where multiple streams were financed with one issuance, we treat each as a separate issuance, splitting the volumes by their funding purpose and assigning both the same cover ratio.
Figure A1: Distribution of debt by investor type

Source: Bruegel based on European Commission and ESM Investor Presentations and Tesoro Público of Spain Chart Pack. Notes: This represents the distribution of investor type based on syndications, not auctions. EU is based on bond syndications from January 2020 to end of February 2023. ESM/EFSF includes all EFSF and ESM syndicated bond issues as at 22 February 2023. Spain is a weighted average of the four syndications that took place in 2022. For consistency across issuers, ‘Banks’ includes the categories ‘Bank Treasuries’ and ‘Other Banks’ reported by the Commission and Spain. The ESM/EFSF do not report ‘Hedge Funds’ as a distinct category.
Table A2: Main characteristics of EU bonds and comparable issuers
|
|
EU |
Germany |
France |
Spain |
EIB |
ESM/EFSF |
|
Median credit rating |
AAA |
AAA |
AA |
A- |
AAA |
AAA/AA |
|
Issuance volume 2022, EUR bn |
176.6 |
448.75 |
595.17 |
232.57 |
44.22 |
58.06 |
|
Share of 2022 issuance by auction (A) and syndication (S) |
A: 50% S: 50% |
A: 96% S: 4% |
A: 98% S: 2% |
A: 87% S: 13% |
A: 0% S: 100% |
N/A |
|
Total outstanding debt (€ billions) |
398.61 |
1,758.95 |
2,328.96 |
1,325.34 |
443.75 |
299.38 |
|
Average cover ratio in 2022 auctions (A) / syndications (S) |
A: 1.85 S: 9.63 |
A: 1.9 S: N/A |
A: 3.07 S: N/A |
A: 2.15 S: 7.05 |
N/A |
4.2 |
|
Average volume per 2022 issuance, € billions |
A: 1.493 S: 4.773 |
A: 2.859 S: 4.250 |
A: 2.160 S: 4.000 |
A: 1.689 S: 7.500 |
S: 0.970 |
1.529 |
|
Haircut category at ECB |
I (from 29 June 2023, before II) |
I |
I |
I |
II |
II |
|
Haircut on 10-year bonds in CCPs (LCH Ltd and LCH SA) |
6.50% 8.00% |
2.75% 3.50% |
2.88% 3.75% |
11.38% 12.25% |
6.50% 8.00% |
6.50% 4.5/8.0% |
|
Share of collateral posted in European repo market |
<0.2%* |
12.5% |
15.8% |
4.8% |
<0.2%* |
<0.2%* |
|
Liquidity indicators, 2022: - Average bid-ask spread - Average daily volume of trades, € billions |
1.35 1.303 |
0.65 20.231 |
0.62 13.365 |
1.05 5.444 |
2.37 0.703 |
3.12/1.96 0.119/0.274 |
|
Example of bond indices inclusion (sovereign or quasi) |
S&P Eurozone Quasi & Foreign Government Bond Index |
S&P Eurozone Sovereign Bond Index |
S&P Eurozone Sovereign Bond Index |
S&P Eurozone Sovereign Bond Index |
S&P Eurozone Quasi & Foreign Government Bond Index |
S&P Eurozone Quasi & Foreign Government Bond Index |
|
Existence of (i) futures market and (ii) repo facility |
No In process |
Yes Yes |
Yes Yes |
Yes Yes |
No No |
No Not active but possible |
|
Obligations/incentives for primary dealers: - Participation in issuances - Quotation on electronic platforms/trading facilities - Active participation in secondary market |
Yes In process Yes |
Yes No No |
Yes Yes Yes |
Yes Yes Yes |
N/A |
Yes No No |
Source: Bruegel based on European Commission, Deutsche Finanzagentur, Agence France Trésor, Tesoro Público of Spain, ESM, EIB, Moody’s, Fitch, S&P, DBRS, ECB, International Capital Markets Association (ICMA), Bloomberg, S&P Dow Jones, LCH Ltd, LCH SA. Notes: Data as of 30 April 2023. The credit rating reflects the median of those issued by Moody’s, Fitch, DBRS and S&P, in S&P terms. The share of issuance by auction and syndication is in terms of volume of overall issuance, not number of issuances. Total outstanding debt comes from national authorities where possible, or from Bloomberg. For Germany, this refers to Federal Debt. The average volume per issuance for the EIB refers to their issuances in euro, which made up 53 percent of their issuance in 2022. The ECB announced in December 2022 that debt instruments issued by the European Union would be re-assigned from haircut category II to haircut category, but this will only take effect from 29 June 2023. * The data on the share of the use of the different issuers’ securities as collateral in the European repo market comes from the ICMA European Repo Market Survey 44 (available at: https://www.icmagroup.org/market-practice-and-regulatory-policy/repo-and-collateral-markets/market-data/icma-repo-survey/), which groups the EU, EFSF, ESM, EFSM and EIB as ‘EU issuers’. The total share of the use of securities from these issuers as collateral in this market is 0.2 percent, but we lack further granularity. The bid-ask spreads referenced under liquidity are on 10-year benchmark bonds. For simplicity, we considered only the S&P Dow Jones Bond Indices, but this is representative across other providers- SSA bonds are not included in these indices. The European Commission has announced that it will initiate work on a repo facility in 2023 for completion by 2024.
Figure A2: Projected annual and total interest costs borne by the EU (in %, as a share of annual EU budgets and of the whole MFF)
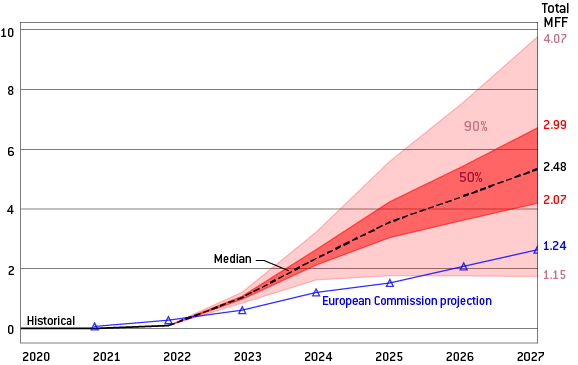
Source: Bruegel based on Danske Bank, Bloomberg and European Commission. Notes: The chart presents historical and projected annual interest rate costs (lines, left scale) and total costs (numbers in bold, right scale) borne by the EU as a share of the EU budget (annual and total over the whole MFF). 50 percent and 90 percent confidence intervals are based on option implied interest rate volatilities (see notes to Figure 6 and methodology detailed in the Annex). The blue line with triangle markers displays the European Commission’s projections from 2021 (https://commission.europa.eu/system/files/2021-01/mff_2021-2027_breakdown_current_prices.pdf).
[1] An exception is the MFA+ programme providing support for Ukraine after the Russian invasion; for this, the EU announced that it would service the interest costs on the borrowing as a mark of solidarity. See European Commission press release of 17 January 2023, https://ec.europa.eu/commission/presscorner/detail/en/ip_23_228.
[2] See details in https://commission.europa.eu/system/files/2020-10/eu_sure_social_bond_framework.pdf.
[3] As of April 2023, only seven countries have requested loans under this facility. The deadline for doing so is August 2023. Unclaimed loans can be used to finance RepowerEU.
[4] ReactEU, Horizon, RescEU, InvestEU, the Just Transition Fund and the European Agricultural Fund for Rural Development.
[5] Between June 2021 and December 2022, €170 billion, including €36.4 billion in green bonds, was issued to support NGEU. From January 2023, the Commission moved to a ‘unified funding strategy’, meaning that EU debt is no longer issued per programme, but through general EU bond. As a result, the breakdown of the share of issuances by programme stops at the end of 2022.
[6] See Christie et al (2021) for a detailed explanation of the EU borrowing strategy, its primary dealer network and the differences between syndicated transactions and auctions.
[7] EU countries agreed in 2020 to increase the EU’s debt guarantees via an added 0.6% of EU gross national income (GNI) in callable headroom (see Christie et al, 2021 for details on the functioning of the guarantee)
[8] Council Decision 2020/2053, available at https://eur-lex.europa.eu/legal-content/EN/TXT/PDF/?uri=CELEX:32020D2053.
[9] For explanations on the fall in the level of interest rates in the decades before COVID-19, see Zettelmeyer et al (2023).
[10] Source: https://commission.europa.eu/system/files/2021-01/mff_2021-2027_breakdown_current_prices.pdf.
[11] See ECB press release, ‘ECB reviews its risk control framework for credit operations’, available at: https://www.ecb.europa.eu/press/pr/date/2022/html/ecb.pr221220_1~ca6ca2cc09.en.html.
[12] They are considered as a Level 1 High-quality liquid assets in Liquidity Cover Ratio calculations and in capital requirements with 0% risk weight for banks under the Basel III framework and no capital charge in solvency requirements for insurance companies in Solvency II.
[13] Passive investing refers to a buy-and-hold portfolio strategy for long-term investment horizons, with minimal trading in the market. Index investing is the most common form of passive investing, whereby investors seek to replicate and hold a broad market index or indices.
[14] The most widely used indices are S&P Dow Jones Indices, Bloomberg Fixed Income indices, ICE Fixed Income Indices, FTSE Russell, MSCI and JP Morgan (Eichert and Tanguy, 2023a)
[15] See the difference in investor base in Figure A2 in the annex.
[16] Council Regulation (EU, Euratom) 2020/2093 of 17 December 2020 laying down the multiannual financial framework for the years 2021 to 2027’, available at: https://eur-lex.europa.eu/legal-content/EN/TXT/?uri=uriserv%3AOJ.LI.202….
[18] These numbers include the auctions of short-term bills. Without them, the share of syndications would be even higher at 69%.
[19] The cover ratio is 9.6 for syndications and 1.9 for auctions, see Table A2.
[20] A swap is a financial contract in which two parties exchange an annual fixed payment for a specified period, in return for a floating short-term rate. The fixed rates for various maturities are used to construct the swap curve. The swap most often used in this case for euro denominated assets is the swap against the six-month Euribor.
[21] See details on the swap market and its benchmark role in Remolona and Wooldridge (2003), Kreicher et al (2017) and Dalla Fontana et al. (2019).
[22] A margin call is a demand from a brokerage house to a customer that more money or securities be deposited in their account when the amount in it falls below what is stipulated as necessary to covers financial transactions.
[23] As noted by the European Systemic Risk Board in a 20 March 2023 letter (https://www.esrb.europa.eu/pub/pdf/other/esrb.letter230320_on_emir_review_mep~058e272ec7.en.pdf). See also Gillian Tett, ‘Brussels ignores derivatives at its peril amid energy crisis’, Financial Times, 8 September 2022, https://www.ft.com/content/b58480fb-b9de-4316-af21-b82167ef3e20. There is plenty of anecdotal evidence supporting this, but not much public data available, as CCPs do not share this data publicly.
[24] It is also impossible to measure precisely this effect given that the ECB does not release the detailed data on its purchases of supranational bonds.
[25] At time of writing, Fitch, Moody’s and DBRS rate the EU’s debt as AAA, while Standard and Poor’s rates the EU’s debt as AA+.
[26] Moritz Kraemer, ‘EU bonds have not lived up to high expectations’, Financial Times, 18 April 2023, https://www.ft.com/content/dc82d584-4961-4af3-ab32-eb504bb3e375.
[27] ‘Hamiltonian moment’ refers to the United States’s first Treasury Secretary, Alexander Hamilton, who consolidated the war debt of the thirteen colonies with the issuance of common debt.
[28] The judgement is available in English at https://www.bundesverfassungsgericht.de/SharedDocs/Entscheidungen/EN/2022/12/rs20221206_2bvr054721en.html.
[29] See European Commission press release of 22 December 2021, https://ec.europa.eu/commission/presscorner/detail/en/ip_21_7025.
[30] The interest costs on the remainder of the EU debt (incurred for SURE and NGEU loans) will be borne directly by the EU countries that have requested these loans.
[31] See the annex for details about the methodology, data sources used and assumptions made to obtain these estimates.
[32] This issue comes on top of the more general problem that in real terms the EU budget is already reduced because inflation has been much higher than the 2% level used every year to transform agreed amounts in 2018 prices into current prices.
[33] The convention of pricing EU bonds against swaps could evolve. It made sense for the EIB, ESM and other SSAs that have a balance sheet and need to manage their balance sheet risks with swaps, but this is not the case for the EU, which does not have a balance sheet nor exactly a lending book, and is already more like a sovereign in that regard, with cash flows coming from indirect taxation.
[34] Darvas (2019) made a similar recommendation based on the fact that the accounting framework of the EU is not used by any other country or international institution.
[35] See the joint declaration by the European Parliament, Council and Commission on the treatment of NGEU interest costs and repayments in the 2021-2027 MFF: https://eur-lex.europa.eu/legal-content/EN/TXT/PDF/?uri=CELEX:32020C1222(04).
About the authors
Related content

The EU needs a methodology for including reform impacts in fiscal trajectories
Such a methodology, and a governance mechanism for managing associated risks, must be in place before the new fiscal framework kickstarts in September

Incorporating the impact of social investments and reforms in the European Union’s new fiscal framework
This paper proposes an approach for quantifying the impact of public investments and reforms on debt sustainability

The impact on the European Union of Ukraine’s potential future accession
This report evaluates the impact on the EU of a possible EU accession of Ukraine, focusing on economic consequences and institutional developments.

Emerging countries have replaced most of Russia’s lost trade with advanced economies
Russian trade overall seems to have suffered little from sanctions; meanwhile, medicine and food trade continues with sanctioning countries