Financial regulatory transparency: new data and implications for EU policy
This paper introduces a new international financial regulatory data transparency index - the Financial Regulatory Transparency (FRT) Index - in order
Highlights
- International financial institutions have promoted financial regulatory transparency, or the publication by supervisors of financial industry data. Financial regulatory transparency enhances market stability and increases democratic legitimacy.
- We introduce a new index of financial regulatory data transparency: the FRT Index. It measures how countries report to international financial institutions basic macro-prudential data about their financial systems. The Index covers 68 high-income and emerging-market economies over 22 years (1990-2011).
- We find a number of striking trends over this period. European Union members are generally more opaque than other high-income countries. This finding is especially relevant given efforts to create an EU capital markets union.
- Globally, financial regulatory data transparency has increased. However, there is considerable variation. Some countries have become significantly more transparent, while others have become much more opaque. Reporting tends to decline during financial crises.
- We propose that the EU institutions take on a greater role in coordinating and possibly enforcing reporting of bank and non-bank institution data. Similar to the United States, a reporting requirement should be part of any EU general deposit insurance scheme.
Financial regulatory transparency refers to the availability of financial industry data made public by supervisors. It has been lauded as a measure to enhance market stability (Arnone et al, 2007) and democratic legitimacy (Gandrud and Hallerberg, 2015). As with fiscal transparency, which concerns the availability of public sector financial data, and monetary policy transparency, which concerns the data monetary policymakers use to set interest rates, international financial institutions have promoted regulatory transparency. Following the East Asian crisis of the late 1990s, the International Monetary Fund (IMF) included transparency in its 1999 Code of Good Practices on Transparency in Monetary and Financial Policies1 and introduced data dissemination standards for making financial data available beginning in 19962. Similar to its measures to promote fiscal transparency, the IMF has established a Financial Sector Assessment Program (FSAP), under which it conducts voluntary reviews of the stability of financial sectors and the development of those sectors. ‘Transparency’ is one key consideration within this programme. While it is up to the country in question to approve publication of the IMF’s FSAP review, most are publicly available online, and they usually include a review of the extent to which a given country observes the Fund’s standards and codes3.
The Basel Committee for Banking Supervision added regulatory transparency to its Core Principles for Effective Banking Supervision in 2006. Within the European Union, the European Banking Authority (EBA) has made a number of recent attempts to promote regulatory transparency, as have other EU financial sector institutions such as the the European Central Bank (ECB) and the European Insurance and Occupational Pensions Authority (EIOPA). We discuss these initiatives in more detail below, but there is currently no measure of transparency that is broadly comparable across countries or that captures whether supervisors make public macro-prudential data.
In order to address this gap in measuring regulatory transparency, we introduce a new international financial regulatory data transparency index. We call it the Financial Regulatory Transparency (FRT) Index. The FRT Index measures whether countries report core macro-prudential data about their financial systems to international financial institutions like the IMF and World Bank. The Index currently covers 68 high-income and emerging market economies over 22 years (1990-2011). The FRT Index is freely available for download at: https://github.com/FGCH/FRTIndex.
Why regulatory transparency is important
Regulatory transparency is important in the context of several ongoing political debates. Regulatory transparency is connected to greater liberalisation of financial markets in other parts of the world, and it can strengthen a capital markets union by making the financial sector more efficient. Gelos and Wei (2005) find that international investors invest less and capital flight is greater during crises in opaque countries. Copelovitch et al (2015) find that countries with greater regulatory transparency pay lower rates of interest on their sovereign bonds when debt burdens increase. The logic for this finding is straightforward: investors have a better understanding of what is going on in a country’s banking sector when regulatory transparency is high, and they are less nervous about implicit liabilities to the government accounts from the financial sector, liabilities which typically go unreported in government budgets (see Irwin, 2015).
Despite the significant benefits of regulatory transparency – including enhancing the efficiency of financial markets and reducing sovereign borrowing costs – the so-called Five Presidents’ Report on Completing Europe's Economic and Monetary Union (Juncker, 2015), in which the presidents of the EU institutions suggest a way forward for the euro area, is curiously silent on the need for transparency in the section ‘Towards a Financial Union’. Nevertheless, the need for greater transparency fits the report’s overall theme of ‘Democratic Accountability, Legitimacy, and Institutional Strengthening.’
One of the best explanations for the need for such transparency comes from Ignazio Angeloni, an ECB Supervisory Board Member and Bruegel fellow-at-large, in a January 2015 speech4. He describes several parallels between monetary policy transparency and regulatory transparency. As with monetary policy, there is a clear rationale for having a politically-independent bank supervisor5. Angeloni identifies a clear time-inconsistency problem because “supervisory forbearance may help protect confidence in individual institutions in the short run, if the supervisor enjoys a high degree of credibility, but is likely to be detrimental to such credibility, and to financial stability, over a longer horizon.” He cautions that there is a difference between the transparency of instruments and transparency about supervised banks, and he argues that proprietary information for specific banks should be treated confidentially. However, he also contends that timely reporting of regulatory information is important for investors and fosters confidence in the banking sector. The main message is that the supervisor should be as transparent as possible, unless transparency raises concerns about the release of proprietary information that can damage a specific bank.
As Angeloni (among others) also notes, there is a general movement towards greater transparency for democratic accountability reasons. Gandrud and Hallerberg (2015) argue that, in order for elected officials and citizens to hold supervisors accountable for acting in the public interest, they need to be able to observe regulatory outputs. Data transparency facilitates this policy objective. The ability to observe policy outputs is especially important in the euro area because institutional structures make it difficult for elected European officials to influence supervisory appointments ex ante.
Existing measures of regulatory transparency
While one can also consider the transparency of information from individual banks that financial supervisors collect (see for example Gandrud and Hallerberg, 2015), we focus here on the reporting of macro-prudential data at the level of a country’s financial sector. Existing assessments of regulatory transparency are based on self-reported surveys of supervisors’ rules and practices. Financial regulatory transparency indices have largely been constructed by summing responses to these survey question. For example, Liedorp et al (2013) sent a 15 question survey to 42 banking supervisors, 57 percent of which replied. The survey had questions on a variety of components related to multiple aspects of regulatory transparency including what they termed economic, procedural, political, policy and operational transparency. They then created composite scores by summing responses to the survey questions for each of the five areas and by creating a total sum score. Arnone et al (2007) used a four-point scale devised from classified IMF staff assessments of country compliance with IMF codes of good practice. Masciandaro et al (2008) conducted a survey of supervisory accountability and included some items related to transparency. Seelig and Novoa (2009) also conducted a survey of supervisory practices, including transparency; however, as Liedorp et al (2013) note, the questions and country details are not publicly available.
Beyond the fact that a number of these transparency indices are not themselves transparent and do not measure reporting to international institutions, they have other shortcomings. First, survey methods are laborious to construct, requiring numerous contacts with supervisors and secondary verification, largely via institutions’ websites. Second, they rely on temporally ephemeral information, eg institutional websites and staff with institutional knowledge. These two issues are of substantive importance because they prevent both the easy updating of the indices at regular intervals and the extension of the indices back in time. These indices are usually snapshots that cannot readily be turned into up-to-date time-series for time-series-cross-sectional analysis. Third, these surveys – at least those not conducted by the IMF – have high non-response rates. Non-response information is discarded in the construction of the indices. Fourth, their construction involves summing responses. This assumes that each item is equally important for measuring transparency. However, it is quite likely that some data items may be ‘easier’ to report than others because they are, for example, less politically sensitive. Fifth, the indices do not include explicit estimates of the degree of uncertainty within which estimates are made. Finally, these approaches either do not incorporate prior information into their estimates or do not do so transparently.
FRT: a new measure of regulatory transparency
To create an index that addresses these issues, we treat financial regulatory data transparency as an unobserved latent variable summarising a country’s likelihood of reporting yearly data on items included in the World Bank’s Global Financial Development Database (GFDD). ČCihák et al (2012) created the first version of the database by collating information that had been tabulated over many years by a number of international institutions6. We include countries classified as high income by the World Bank and countries on JP Morgan’s Emerging Market Bond Index (EMBI). We also include China, as it is not in the EMBI. Using these criteria, the dataset covers 68 countries, 22 years (1990-2011) and 13 items7, which are variables for quantities such as bank deposits, liquid liabilities and non-bank financial institutions’ assets.
In order to calculate the FRT index, we used a tool called Dynamic Hierarchical Bayesian Item Response Theory Modelling. Item response theory (IRT) was initially developed in the field of educational testing. When testing students, teachers try to measure students’ underlying, or ‘latent’, ability in a subject such as maths or biology. A simple way to do this would be to add up all of the correct responses to each test question (item). However, some questions are harder to answer than others. It may not be possible to anticipate beforehand how hard students will find each question to be. IRT models allow us to estimate how difficult questions are and incorporate this information into our estimation of how able students’ are in the subject.
We can use this method to measure transparency as well (see Hollyer et al, 2014). In place of a dataset of student’s correct/incorrect answers to test questions, we created a dataset of whether or not a country reported each of the 13 items in the GFDD in each year. Rather than measuring a student’s latent ability in some academic subject, we used IRT to measure countries’ latent propensity to release data to the GFDD – ie be transparent – in each year. We measure how ‘difficult’ each item is to report and we estimate weights of how much each item contributes to the transparency index by how often it is reported across all countries in our sample.
We find that the least-reported items, ie the most difficult items to report, relate to non-bank institutions: reporting mutual fund assets, insurance company assets, and other non-bank financial institutions – including post-office savings institutions, building and loan associations, development banks and offshore banking institutions. ‘Easy’ items to report tend to involve quantities for deposit banks such as bank credit to bank deposits and financial system deposits assets, as well as central banks such as central bank assets.
Dynamic Hierarchical Bayesian Response Theory Modelling also enables us to include prior information from countries’ reporting in previous years, thus improving our estimates of how likely each country was to report in later years. Finally, this method enables us to estimate our uncertainty about the transparency scores. This helps us avoid differences between countries being exaggerated, a problem that plagues many other governance indices, especially those that simply ordinally rank countries.
For full details about our model and its validation see:
Trends in regulatory transparency, 1990-2011
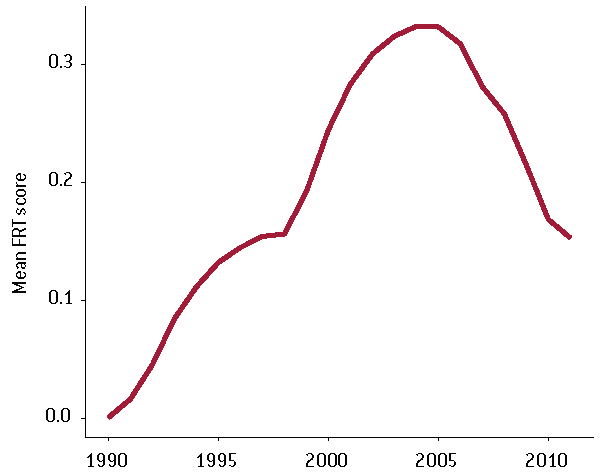
Many countries’ FRT scores have changed dramatically over the past 20 years. Before looking at changes in countries and country groups, it is useful to consider the overall patterns in the data. Figure 1 shows the mean FRT score between 1990 and 20118. Most countries have FRT scores close to zero. This means that they generally report items that are estimated to be easy to report, but not the difficult items. A country moves away from zero either when it reports the more difficult items related largely to non-bank financial institution data (thereby achieving higher positive scores), or when they do not report the easy items (thereby earning negative scores). On average, international reporting of financial regulatory data increased from 1990 through about 2005. From 2006, reporting declined, with most of the years with the steepest declines occurring during the recent financial crisis. There is another interesting and possibly related dip in average global transparency: while average transparency largely increased from 1990 through the mid-2000s, there was a noticeable stagnation in 1997 and 1998. This was the height of another multi-country financial crisis and, as we discuss further below, during the multi-country restructuring of the French bank Crédit Lyonnais – the largest bank failure up to that point.
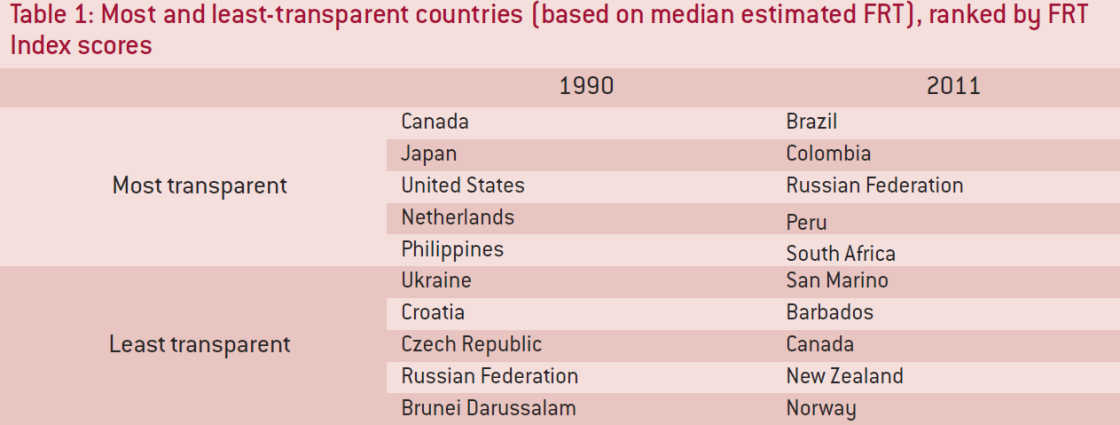
Table 1 shows the countries with the top and bottom international financial regulatory data transparency scores in 1990 and 2011. The countries at the top and bottom of the FRT Index in 1990 divide roughly into more and less- developed economies. Interestingly, the 2011 scores seem to have flipped. A number of countries that were opaque in 1990, such as Russia, become very transparent in 2011. Likewise, once highly transparent countries, New Zealand and Norway, became opaque by 2011, while Canada moved from most transparent to third least-transparent country.
Figure 1: Mean FRT Scores (full sample)
Source: Bruegel.
Transparency trends in the European Union
This section compares the level of transparency in the EU with other high-income economies. To check whether the standards are higher in the euro area and to be sure that we not picking up only changes in accession countries in the mid-2000s, we focus on members of the euro area, and the pre-2004 member states (the EU15). Figure 2 compares the mean FRT Scores of euro-area and EU15 countries to those of other high-income countries in the sample. It illustrates that EU member states are less transparent in reporting national aggregate data to the IMF and World Bank compared to other high-income countries. In Figure 3, which shows FRT scores for the euro-area countries in the sample, we can see that almost all have scores close to zero for much of the sample period. Through the mid-2000s, non-EU high-income countries offered on average more international regulatory data transparency than either euro-area or EU15 members. The reason for the discrepancy is that few European countries report non-bank financial institution data – eg data on assets from insurance companies, state-owned non-bank institutions, postal savings banks, investment banks, and offshore financial institutions9 – over the entire sample period. Since about 2004, many euro-area countries have stopped reporting a basic quantity: the bank lending to deposit spread (see Figure 7). Only during the height of the financial crisis did reporting in other high-income OECD countries decline towards the low average level of EU member states. The US is notable for both its relatively high transparency level and its consistency in reporting data, even during the financial crisis. No EU country has ever achieved a median transparency score at or above the US’s 1.1 level10.
While these are findings on macro-prudential data, we note that there is already interesting work on regulatory transparency in the EU at the micro level. Gandrud and Hallerberg (2015) examined whether or not EU member-state regulators regularly release regulatory data about individual banks. They found that overall member states were markedly opaque, especially when compared to US regulators. The FRT considers the transparency of the overall financial sector, not just the banking sector, and the dataset consists of country aggregates, rather than individual bank information. But the evidence suggests a similar trend to that found with the micro data--when compared to other countries at a similar income level, transparency in the EU is lower.
Figure 2: Mean FRT scores for euro-area members and the EU15 vs. all other high-income countries
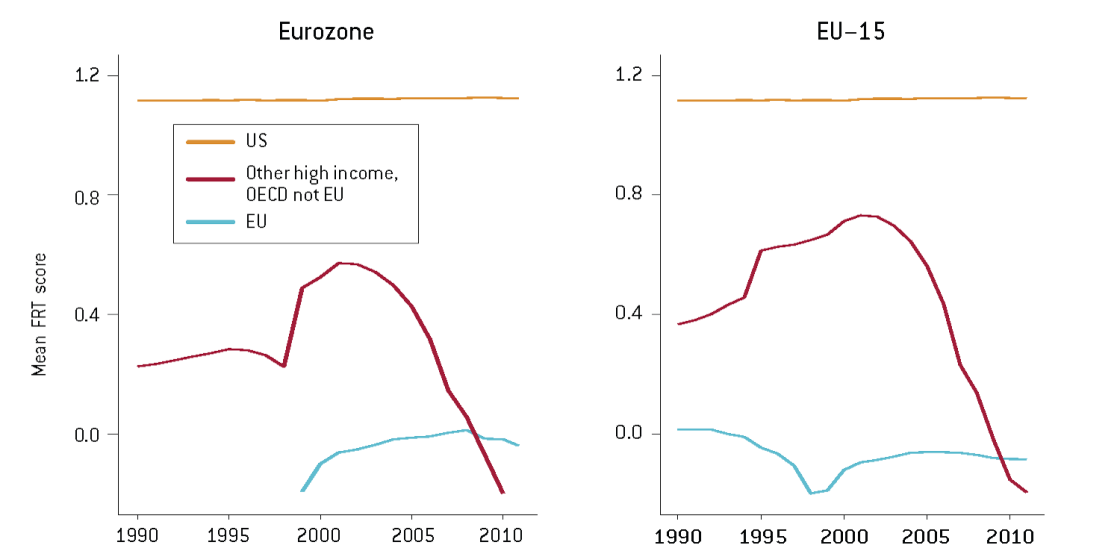
Figure 3: FRT scores for each country in the euro area by 2015 included in the FRT sample

Source: Bruegel. Note: Points indicate median estimated FRT scores. Thin lines indicate the 95 percent highest posterior density of the estimated scores, ie a range where the real score most lies. Thick lines indicate highest 90 percent posterior densities. The same intervals are used throughout this paper.
Increasingly transparent countries
The patterns of change in the overall dataset are instructive for understanding the position most European countries face. Moving beyond the EU countries, we see that a number of countries made significant improvements in reporting during the 1990s and 2000s. Figure 4 shows the transparency scores for the fifteen countries that made the largest cumulative improvements to their median FRT scores from 1990 through 2011. These countries tended to be upper middle-income countries such as Argentina, Brazil, the Czech Republic, Croatia, Russia, and South Africa, which went through considerable processes of opening up to international capital markets during the sample period (Ahmed and Zlate 2014). Reporting more financial system data to international financial institutions may have been part of this process, since making such data available to foreign investors via the IMF and World Bank could have given investors more information on which to make judgments about financial system risks. These significant increases in transparency might also have contributed to these countries’ ability to attract foreign investment over the last two decades.
Germany, as a high-income, industrialised country, is seemingly a notable outlier in this subsample. However, the general process behind Germany’s increasing transparency may be similar to that of the emerging market economies. Germany’s traditionally parochial capital markets went through a process of financial market liberalisation and internationalisation during this period (Jacob, 2015).
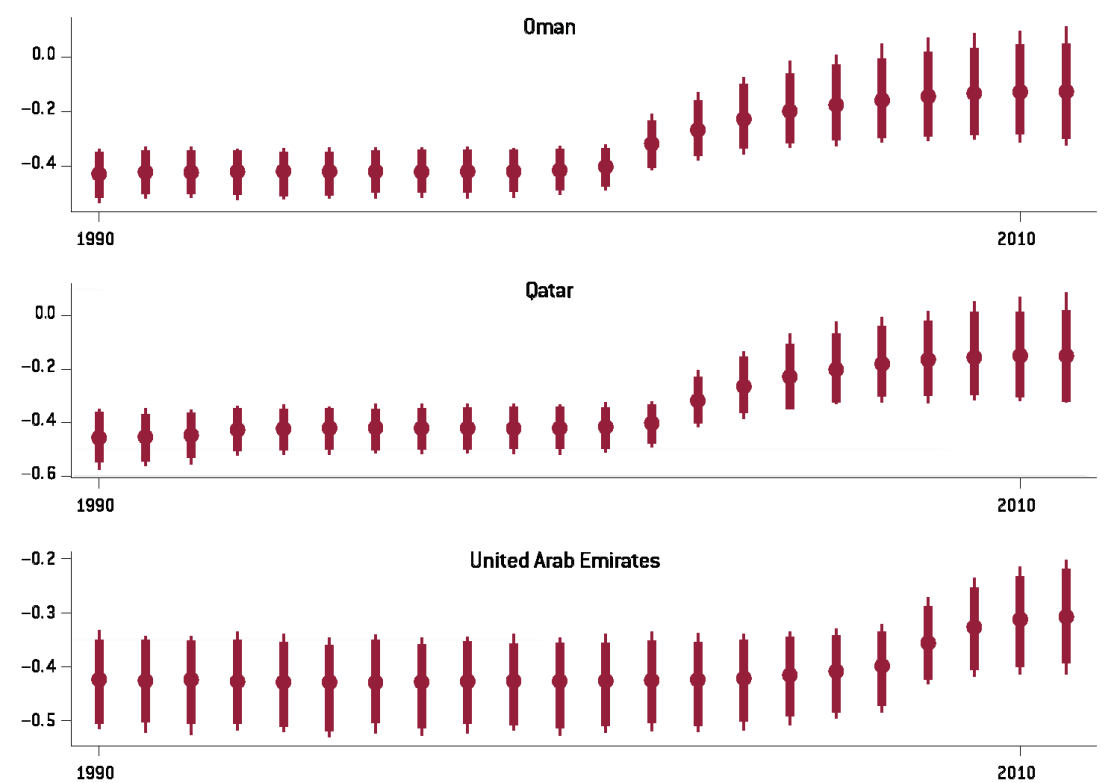
A group of small Persian Gulf states became noticeably more transparent recently. Though they are still fairly opaque (see Figure 5), they improved during the mid to late-2000s. This was a period where Qatar, Dubai and Abu Dhabi were attempting to transform themselves into international financial centres. This finding is informative given the efforts to complete a capital markets union in the European Union, because it suggests that jurisdictions that want to pursue deeper financial market integration become more transparent.
The finding from the countries that increased regulatory transparency is the same – increases in transparency are accompanied by the opening up and deepening of financial markets overall. This point is relevant for efforts to develop a capital markets union in the EU.
Figure 4: FRT transparency scores for the 15 countries with the largest cumulative reporting improvement (ordered by improvement rank).

Source: Bruegel.
Figure 5: FRT transparency scores for three Gulf States
Source: Bruegel.
Increasingly opaque countries
Figure 6 shows the 15 countries that had the greatest cumulative decline in their financial regulatory data reporting between 1990 and 2011. One particularly interesting case is Hungary. In 1990 Hungary had a median FRT score above 0. This score changes over time, with a clear shift to low transparency in 2009. The 2009 figures would have been reported to international institutions in 2010, the year that Viktor Orbán’s Christian Democratic People’s Party entered government. This government introduced a number of major economic and financial policy changes that sometimes directly contradicted Hungary’s international economic commitments, including reducing the independence of the central bank. The same political process might have caused Hungary to dramatically reduce its reporting of financial regulatory data to international institutions.
Such a shift towards opacity is not only confined to countries that so openly rejected international standards. There is a large group of established democracies with surprising declines in financial regulatory data reporting over the sample period, including Denmark, New Zealand, Japan, Israel, Norway and Canada. Canada is a particularly extreme example: from the beginning of the sample (1990) through 2006, Canada reported all of the items in the Index, thereby earning the highest FRT score, by far, over this period. However, reporting declined from 2006, to the point that, from 2009-11, Canada only reported about 20 percent of the component variables in the FRT Index.
It is not yet clear why the reporting of financial regulatory data in these countries has declined so dramatically since the mid-2000s. This has not been the general trend in established democracies. For example, why did Norway virtually stop reporting, while Sweden changed very little over the entire period? Why did reporting in Canada decline so dramatically, while reporting in the US has held constant at a relatively high level? More work is needed to understand why some countries that otherwise closely adhere to international reporting standards virtually stopped reporting data on their financial systems to the World Bank and IMF starting in the mid-2000s.
Figure 6: FRT transparency scores for the 15 countries with the largest cumulative reporting declines (ordered by decline rank)

Source: Bruegel.
Financial transparency during episodes of financial stress
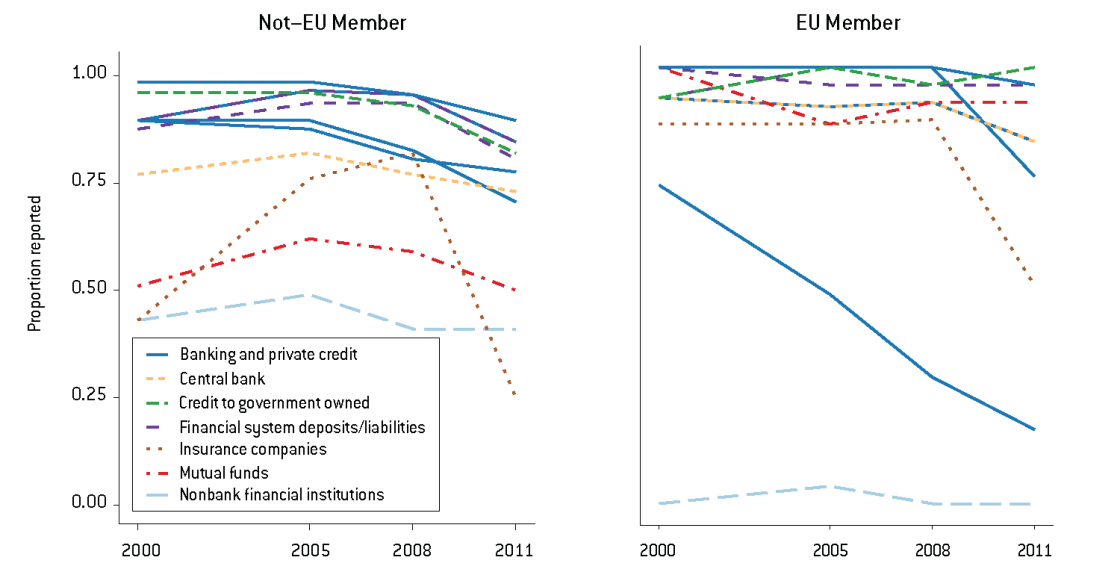
Episodes of financial stress are sometimes associated with declines in financial data reporting. Reporting declined noticeably during the recent global financial crisis. Figure 7 shows the proportion of countries reporting each of the 13 items in the years 2000, 2005, 2008 and 2011. Reporting of many items related to bank deposits, private credit and insurance institution assets declined notably from 2008, although for some variables and countries (such as bank lending-deposit spreads in the EU countries), reporting had been declining for a number of years prior to the onset of the global crisis.
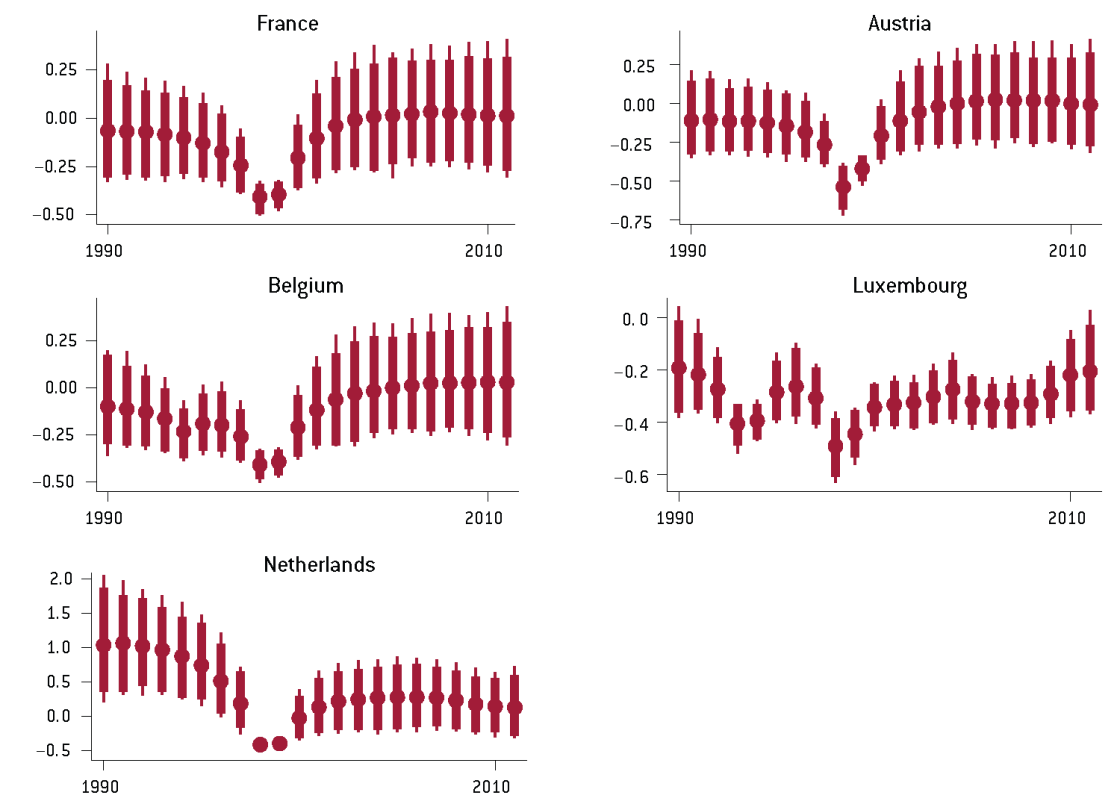
Another striking example of the decline in transparency during episodes of financial stress is the simultaneous drop in reporting by France, the Benelux countries and Austria in the mid- to late 1990s (see Figure 8). This decline immediately followed the collapse and controversial bailout of France’s largest bank, Crédit Lyonnais, as a consequence of its gross mismanagement. At the time, according to Caprio and Klingebiel (1996), Crédit Lyonnais’ collapse was the largest bank failure globally. In the wake of the Crédit Lyonnais collapse, France, the Netherlands, Belgium and Austria simultaneously stopped reporting seven of the 13 items – most referring to credit provision by banks11 – in the FRT Index in 1998; Luxembourg largely followed suit in 1999. This dramatic reporting decline coincides with a specific phase of the Crédit Lyonnais restructuring process: the sale of the core French institution and its non-French subsidiaries. Specifically, Crédit Lyonnais’ subsidiaries in Belgium, the Netherlands and Austria were sold off. Crédit Lyonnais (Belgium) was sold to Deutsche Bank and Crédit Lyonnais (Austria) was sold to Anglo Irish Bank in 1998. Crédit Lyonnais Bank Nederland was sold to the Belgian Generale Bank in 1995 and subsequently became Generale Bank Nederland. At this point, it is not clear exactly why reporting decreased so markedly during this period. However, this episode does demonstrate that transparency practices might be ignored during times of severe financial crisis or stress, especially if reporting practices are not fully institutionalised.
Figure 7: Proportion of countries reporting each item in the FRT (grouped by sector type)
Source: Bruegel.
Figure 8: FRT transparency scores for France, the Benelux countries and Austria
Source: Bruegel.
Conclusion: policy proposals for a more transparent union
Our findings using the FRT Index demonstrate that the availability of financial regulatory data transparency varies considerably in different countries and over time, both within and beyond the EU. European countries provide a relatively low level of transparency compared to other high-income OECD countries. This is especially true when we compare EU members to another large banking union: the United States. In order to improve the efficiency and democratic accountability of the European banking and capital markets unions, it would be useful to institutionalise the reporting of financial system data to international institutions such as the IMF and World Bank.
We propose that the European Central Bank, European Banking Authority, the European Insurance and Occupational Pensions Authority and the European Securities and Markets Authority – which together have supervisory powers and access to the relevant data on currently under-reported quantities – take a greater and more active role in coordinating the reporting of regulatory data to the IMF and World Bank. Especially within the euro area, this would have the benefit of improving the euro area’s relationship and representation with the IMF. While these are European-level institutions, they should report the national-level data in order to ensure greater regulatory transparency for the euro area as a whole and for its member states. Even though this type of data is not directly within the scope of the capital markets union, such reporting is certainly in the spirit of creating a more efficient financial sector.
This increased transparency is extremely important. It provides markets and voters with more information about the relative health of a country’s financial sector. Past empirical work shows that markets are more nervous about countries that have less regulatory transparency when their debt burdens increase. The reason is that markets do not know what other liabilities the government might face, and they punish the less-transparent countries with higher interest rates. This transparency is also relevant for increasing the ability of voters to hold their institutions accountable.
Finally, and relatedly, one might ask if the problem is not with the supervisor releasing the data but with the relevant institutions that are not reporting it. That is, a supervisor cannot report data it does not have. As we discussed in past work (Gandrud and Hallerberg 2015), there is also an issue of regulatory transparency for individual banks. In the United States, where this type of transparency is high, banks fall under the US common deposit insurance scheme only if they report reliable data that the supervisor then makes public. Given the initial moves towards a common deposit insurance scheme in the European banking union, a similar requirement should be part of any extension of deposit insurance across borders, be it as a common pool or as linked pools of different national programmes.

