The European Union’s growing innovation divide
This Policy Contribution examines the EU’s struggle to improve its capacity for innovation, in particular the differences between EU member states in

Highlights
There is a significant divide between the European Union countries with the greatest capacity to innovate, and those with the least capacity to innovate. The difficult convergence process has been proceeding only very slowly and unevenly, and more recently seems to have come to a halt.
For footnotes and references, see the PDF version of this paper.
A particular weak spot for the EU is corporate investment in research; in this area, the intra-EU divide is growing. As the business sector is responsible for the persistent R&D intensity gap between the EU and the United States and Asia, the persistent failure of lagging EU countries to catch up in this area provides much of the explanation for the EU’s weak performance compared to other economies.
The evidence shows that the deployment of public budgets and the mix of policies employed by EU member states have tended to aggravate the intra-EU divide.
The EU needs to better understand its growing internal innovation divide if it is to achieve its ambition of becoming a world innovation leader.
1. Introduction
The European Union’s lofty ambition is that its growth should be socially and environmentally sustainable and its future prosperity should be built on foundations of innovation. But ambition has so far not translated into leading performance. According to the European Commission’s 2015 Innovation Union Scoreboard indicator (IUS), a composite indicator developed to assess innovation performance, Europe is not doing well. The EU’s IUS score is only 81 percent of that of the United States. For the moment, Europe still has a substantial lead over emerging markets. But China, with an IUS score still half of the EU's, is catching up fast. On private expenditure on research and development, a key indicator to assess a nation’s capacity for innovation, the EU is lagging significantly. Its private R&D-to-GDP ratio is 57 percent of the US level. In terms of public expenditure on R&D, there is no gap between the EU and the US. But Europe’s overall R&D-to-GDP-ratio continues to stand at 2 percent, far from the EU's 3 percent target and significantly lower than the US, Japan, South Korea and Singapore. China has caught up fast and in terms of overall R&D spending is already on par with the EU.
This Policy Contribution examines the EU’s struggle to improve its capacity for innovation, in particular the differences between EU member states in terms of their capacity to innovate. Is the EU’s failure to catch up a failure of its innovation-leading member states to defend and further improve their leading positions? Or is it because its innovation-lagging member states fail to catch up and the EU has not closed the innovation divide between its member countries?
We show a serious divide between EU member states in terms of their capacity to innovate, with convergence taking place only very slowly and unevenly. More recently, the already-difficult convergence process seems to have come to a halt.
In terms of the innovation policies used by member states, the evidence shows that the deployment of public budgets and the mix of instruments might have aggravated the divide.
2. The innovation capacity of EU member states: a growing divide
The innovation capacity of nations measures their ability to generate new ideas and to translate them into economic growth and prosperity (Furman et al, 2002). Because of differences in initial conditions and because of differences in how EU countries have sought to create innovation-based growth, we can expect substantial differences between European countries in terms of innovation capacity. We would however expect that the process of EU integration would allow lagging countries to catch up faster, pushing convergence within the EU in terms of innovation capacity, along with economic convergence.
In order to assess countries’ innovation capacities, a range of factors needs to be explored. In addition to the availability of R&D inputs, public R&D infrastructure and financing, this includes the linking of public and private bodies involved in innovation, incentives for firms to innovate, and the ability of firms to create and capture value from their innovations on world markets (Furman et al, 2002). To measure innovation capacity, we use the Summary Innovation Index from the IUS. This covers eight aspects of innovation capacity: human resources, public research systems, finance, investment by firms, linkages, intellectual property rights, innovations and economic effects1. We measure the variation in innovation capacity across the EU countries. Convergence occurs when the variation decreases over time. The divide in innovation capacity measures the gap between the best and worst performers within a group of countries2.
When looking within the EU at differences in IUS performance (Table 1), the countries at the top are Denmark, Finland, Germany and Sweden, while Bulgaria, Latvia and Romania sit at the bottom. The gap between best and worst performer is significant, illustrating the major differences in innovation capacity between EU countries. Although the gap decreased from 2006-13, reflecting a slow process of convergence, it remains substantial. Furthermore, the convergence process slowed after 2008, coinciding with the start of the crisis. There has been no convergence since 2010.
Table 1 shows that the innovation leaders have progressively improved their IUS scores. All other groups of countries have also improved their scores, and at a faster rate than the innovation leaders, as the shrinking gap scores show. This illustrates a slow process of catching-up within the EU. The innovation followers narrowed the gap the most. The bottom group of modest innovators caught up relatively rapidly between 2006 and 2008, but have lost momentum since.
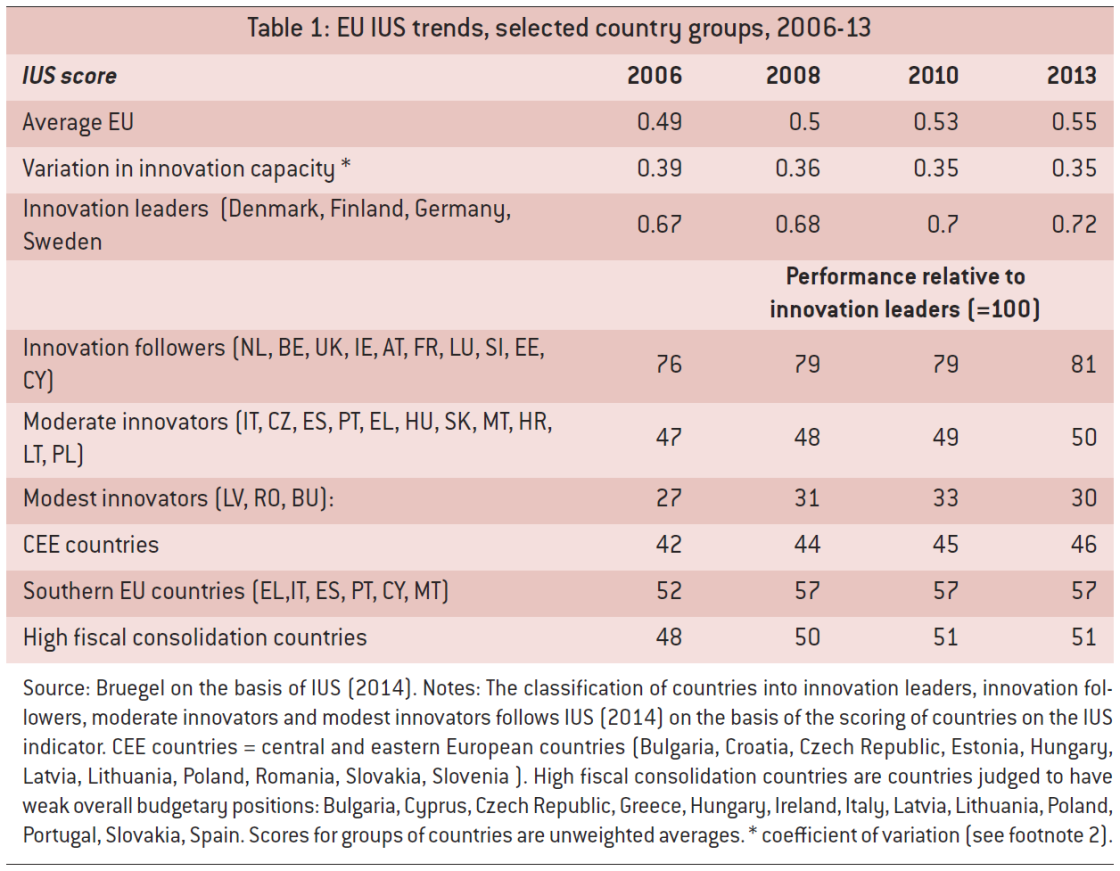
The southern EU countries made considerable progress in the pre-crisis period, but their process of converging with the leaders has halted since 2008. In contrast, in the central and eastern European countries, catching up continued after 2008, albeit at a reduced pace.
Most of the central and eastern European and the southern EU countries have been through significant fiscal consolidation since 2008. There is a serious innovation capacity gap between the countries in high fiscal consolidation mode and the innovation-leading countries (which are all countries with low levels of fiscal consolidation). This gap is only very slowly being bridged, with a pace of convergence that slowed after 2008 and stopped after 2010.
Table 2 shows a similar breakdown of information to Table 1, but for the eight components of the Summary Innovation Index. It shows that the EU has made on average substantial improvements in terms of human resources and the public research system (science), which used to be weak spots. However, the EU remains weak on investment by firms: for this component, the EU average IUS score is lowest, and there is no sign of improvement. On the contrary, performance has slipped. This area has persistently been Europe’s weakest spot in terms of innovation capacity.
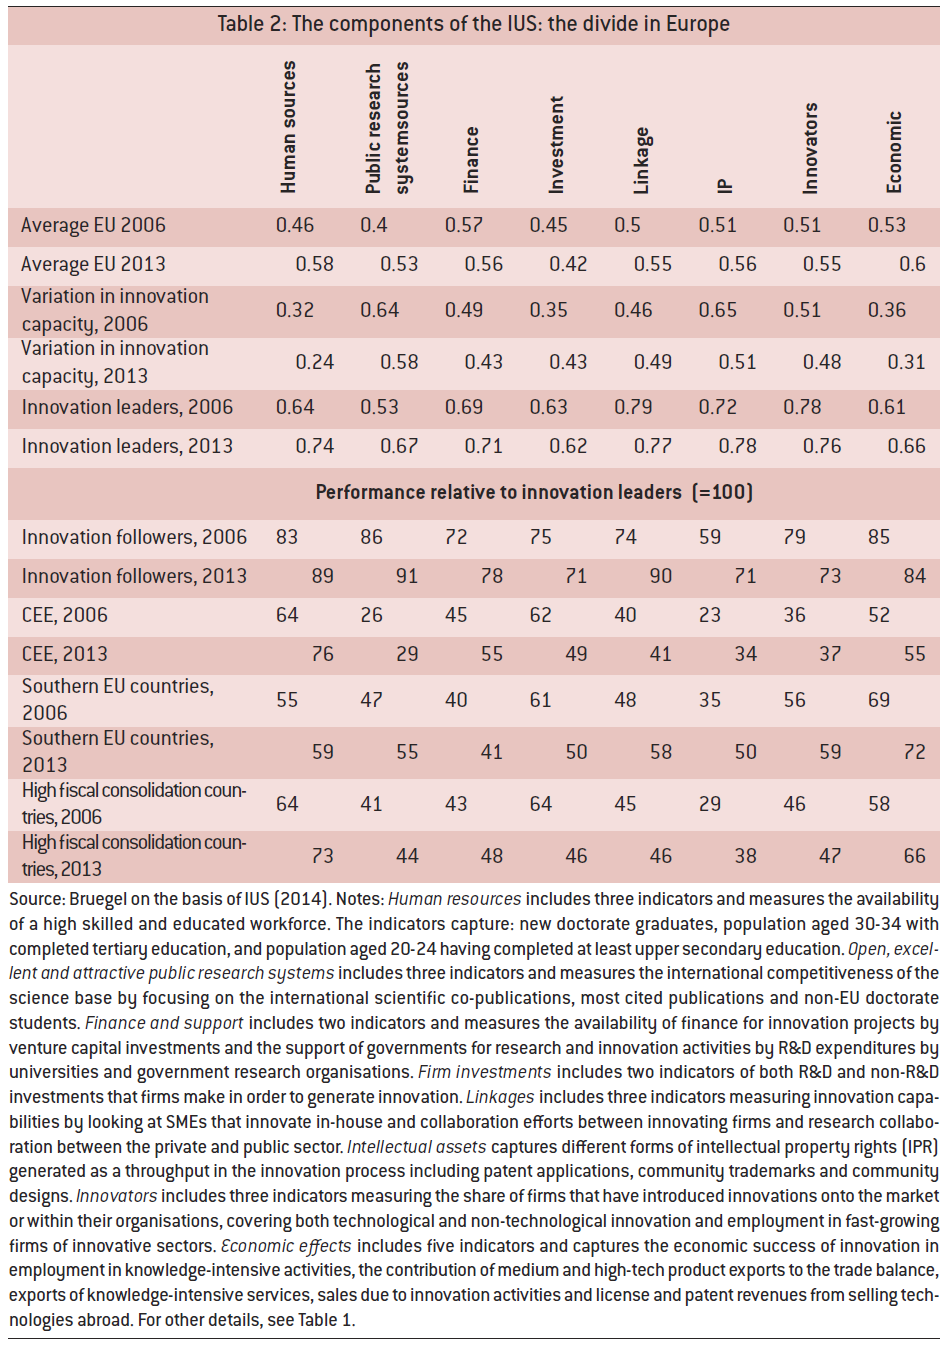
The inability of the EU to address its weak performance in terms of investment by firms, relative to competing economies, correlates with an increasing divergence between EU member states in this area. In particular, the gap between the innovation-leading countries and the innovation-lagging countries in high fiscal consolidation is growing.
As it is the business sector that is responsible for Europe’s persistent overall R&D intensity shortfall relative to the US and Asia (Veugelers and Cincera, 2010), the persistent failure of lagging EU countries to catch up in this area goes a long way to explain the EU’s slowness to catch up with others economies on this key indicator.
For the other components of the IUS, the gap between EU member states has decreased over time. Nevertheless, the gap remains large for research systems. The greatest convergence is measured for the human resources and economic impact components. The latter is especially encouraging, because its shows that countries can catch up in terms of the economic benefits from innovation even when not catching up on all components of innovation capacity.
When looking country-by-country, the innovation-leading countries score high on all the components of the IUS, reflecting the systemic nature of well-performing innovation systems. They have managed to increase their scores on human resources and the public research system (science) as enablers of innovation capacity. Investment by firms remains a challenge even for the innovation-leading countries, which stand out most clearly in terms of their capacity for linkage and IP protection.
While the central and eastern European countries have been catching up on most IUS components, they have fallen further behind in terms of investment by firms. The gap also remains substantial for linkages. But the biggest gap between the innovation leaders and the central and eastern European countries is for the public research system, and this gap is only slowly closing.
For the southern EU countries, the largest gap with the innovation leaders is for finance as an enabler, with very little evidence of catching up. This could have significant implications for their future prospects because the southern EU countries are also in high fiscal consolidation mode. Also on investment by firms, the southern EU countries have been losing ground relative to the innovation leaders, similarly to the central and eastern European countries.
3. Assessing differences between innovation policies in EU countries
A country’s optimal innovation policy mix will depend on its level of innovation capacity and should dynamically evolve along with, and drive, its development path. Differences in innovation policies deployed by EU countries should therefore be expected, in line with the differences in their innovation capacities. There is no one-EU-size-fits-all optimal innovation policy prescription. To close the innovation-capacity divide in the EU, sufficiently differentiated innovation policies in member states, which are tailored to address each country’s specific innovation capacity position, are needed.
In this section we assess the research and innovation policies that EU countries have in place: do they differ and do the differences reflect the differences in countries’ innovation capacities? Can the innovation policies that are in place address the growing innovation-capacity divide between EU countries?
We will consider: (i) how much public money is spent on research and innovation; and (ii) how the public funds are spent, ie what instruments are deployed and with how much money. For public funds, we use the information provided in the government budget appropriations or outlays for research and development (GBAORD) data, reported yearly by Eurostat. For individual instruments, we use the TrendChart database3. We consider only innovation policies at member state level, ignoring the EU level.
3.1 A growing divide in public spending on research and innovation (R&I) in Europe
Table 3 shows GBAORD as a percentage of GDP for the EU as a whole. It shows first that public spending on R&I is in general very low in Europe, but is gradually increasing. This increase was most pronounced in the pre-2008 period; the increase slowed markedly after 2008 and there has been no increase since 2010.
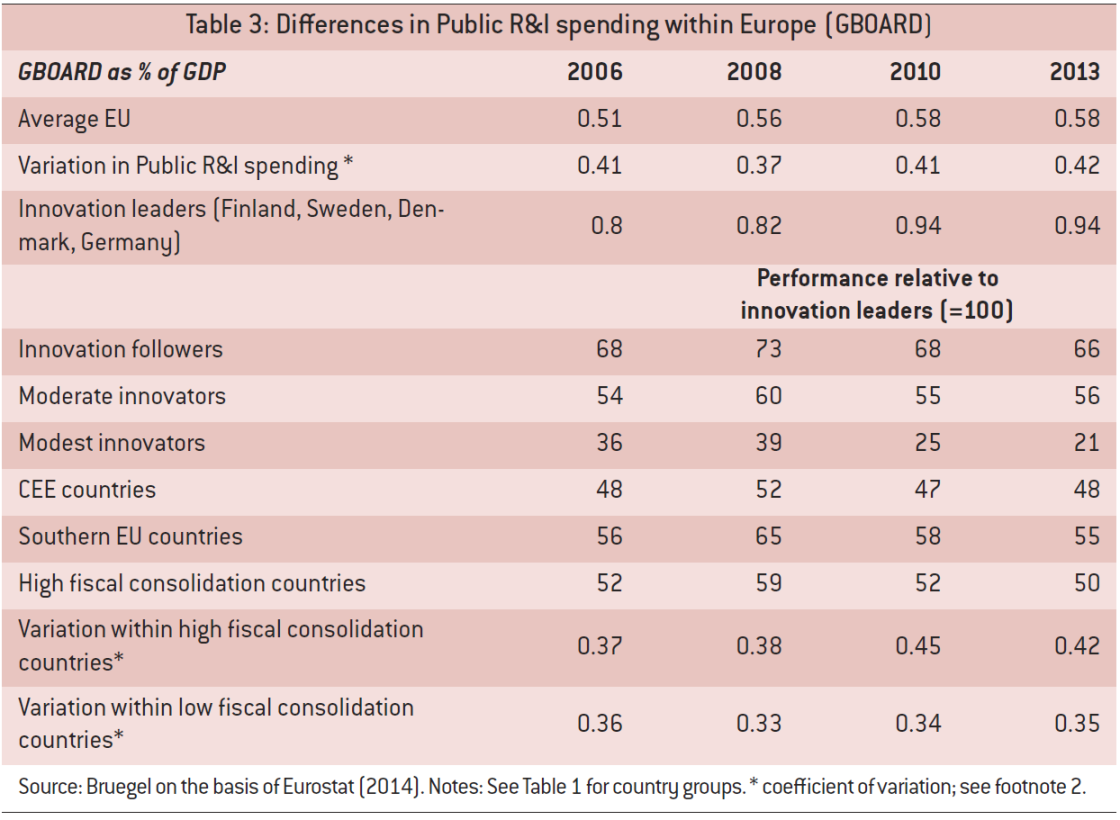
There are significant differences in the amounts spent by EU member states. These differences in public spending (relative to GDP) are closely related to the positions of countries in terms of their innovation capacity (as measured by IUS). Innovation-leading countries spend more than innovation followers, which in turn spend more than moderate innovators. Modest innovators spend the least. Viewing public spending as a policy instrument for catching up, one would have expected more of an inverted relationship, with spending on R&I (as a share of GDP) to be more prominent in the countries that are catching up.
While there was catching up by innovation followers, moderate and modest innovators before 2008, this stopped after 2008 and even went into reverse, leaving a bigger divide in public spending on innovation in 2013 than in 20064. This stalled catching up and further falling behind is evident for the central and eastern European countries but even more so for the southern EU countries.
High fiscal consolidation countries show on average a pattern of stalled catching up and further falling behind after 2008 compared to the innovation leaders. However, there has been at the same time a growing gap after 2008 between the best and worst performers among the high fiscal consolidation countries. Hence, the differences between EU countries in terms of public R&I spending have increased since the crisis, not only because of an increasing divide between fiscally stronger innovation-leading countries and fiscally weaker innovation laggards, but also because of a bigger divide within the group of fiscally weaker innovation laggards. For example, while Portugal and Spain scored similarly in 2006 (with 0.67 percent of GDP spent on R&I), Portugal has managed to safeguard its public R&D spending relative to GDP better than Spain, leaving a ratio of 0.93 percent in 2013 for Portugal versus only 0.54 percent for Spain in 2013.
3.2 Innovation policy instruments used in Europe
Beyond the size of the public budget spent on R&I (relative to GDP), it also matters on which components of innovation capacity the budget is being spent. Table 4 shows the most important innovation policy instruments over the period 1990-2013 in EU member states, in terms of share of total funding reported by Trendchart5.
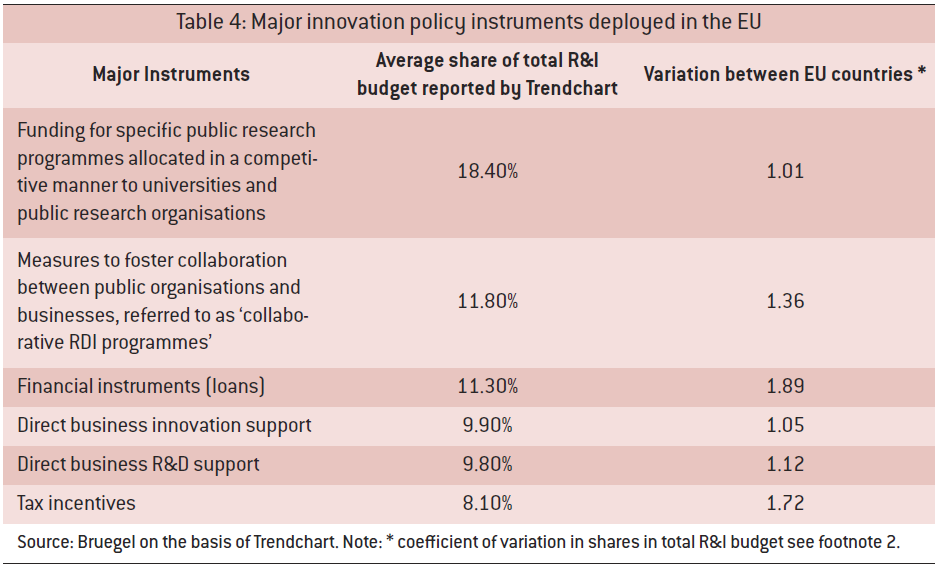
Together the six instruments reported in Table 4 account for 70 percent of the R&I budget outlays in the EU, as reported by TrendChart. This six-pack of innovation policy instruments makes up the bulk of the reported spend in all EU countries, irrespective of their innovation performance: 76 percent for innovation leaders, 71 percent for innovation followers, 64 percent for moderate innovators and 70 percent for modest innovators (see Veugelers, 2015). The biggest gap between EU member states within this six-pack of instruments is for the use of loans and tax instruments.
We group all the innovation policy instruments reported in TrendChart into five areas:
- Skills: support for human resources for R&D; innovation skills development;
- Support for public R&D: R&D infrastructure: competitive funding for research (for higher education institutes and public research organisations); centres of excellence; public sector innovation;
- Support for firm R&I investment: tax incentives; loans; direct business R&D support; direct business innovation support; innovation support services; support for start-ups; innovation networks and platforms; innovation vouchers;
- Linkage support: incubators; technology transfer; collaborative R&D programmes; mobility schemes; science and technology parks; cluster initiatives; spin-off support; competence centres;• Other: awareness raising; support for venture capital; E-society; IPR measures; public procurement; regional programmes.
(Note: the six main instruments are underlined).
By grouping policies this way, we can more closely overlay the innovation policy instruments deployed by member states on their IUS scores on the various components of innovation capacity (Table 2).
Table 5 shows the share of public R&I spending taken by each of these five areas for groups of EU countries, using TrendChart data. The largest share of EU countries’ spend goes to support firms’ investment in R&I (with various instruments), followed by programmes to support public R&D (excluding institutional funding) and programmes to support linkages within the innovation system.
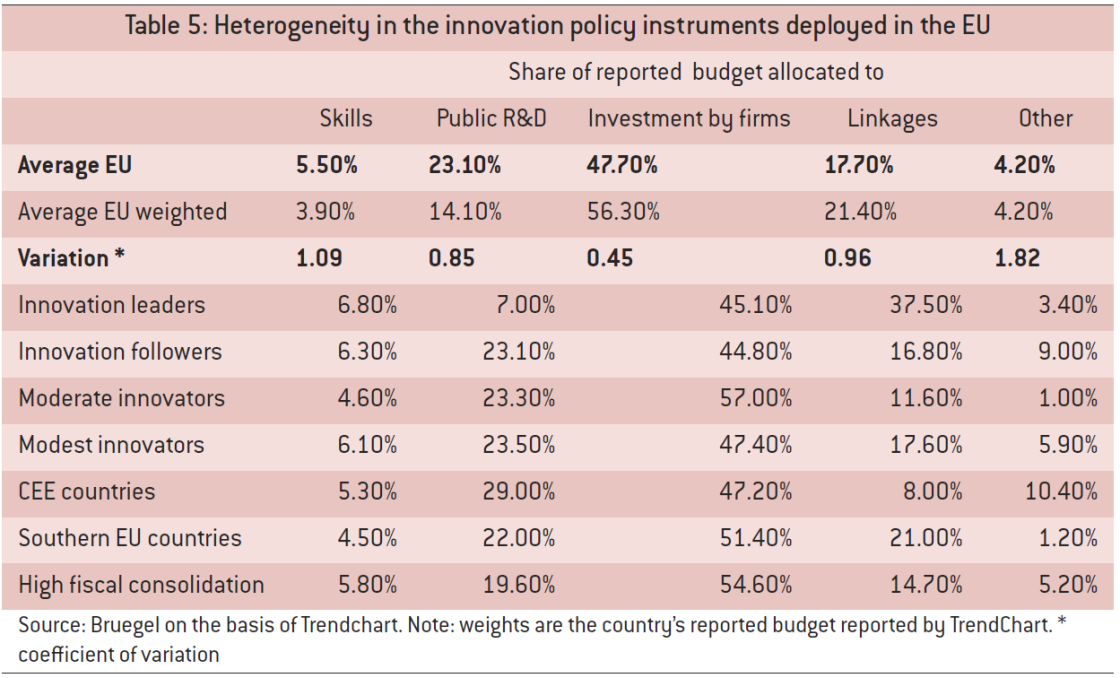
There are limited differences between member states in the reported budget shares for support for firm’s investments. In all groups of countries, these instruments take up somewhat less than half of the total public budget6. There are also limited differences between east and west, northern and southern Europe, and between low and high fiscal consolidation countries. This relative homogeneity in the deployment of this instrument is a mark of of investment by firms being the weak spot for almost all EU countries in their innovation capacity development. Nevertheless, as there is a substantial and increasing gap between innovation leading and following countries in Europe, one might have expected that greater emphasis would have been put on this instrument by non-leading countries.
On programmes to support public R&D capacity building, the results need to be handled with care because the TrendChart data includes only competitive funding programmes and does not include institutional funding for research at public institutes. The relatively low spend in this area in the four innovation-leading countries stands out. The non-leading countries all spend a significantly greater share of their budgets on competitive funding programmes. The central and eastern European countries spend the highest share of their budget on this instrument. As Table 2 shows, it is also for the IUS component of ‘open, excellent and attractive research systems’ that there is a huge and persistent gap between the central and eastern European countries and the EU’s innovation-leading countries. The somewhat higher share of the budget spent on competitive funding programmes for public R&D is definitely not commensurate with the size of the gap that needs to be bridged for these countries, particularly taking into account the lower overall size of the budget for public R&D support in central and eastern European countries (Table 3).
The innovation-leading countries stand out most prominently in terms of the share of their reported budgets that they devote to programmes to support linkages. Finland for instance spends 51 percent of its R&I budget on collaborative R&D programmes. ‘Linkages’ is also a component of the IUS Summary Innovation Index, for which the innovation-leading countries substantially out-perform other EU countries. This is especially the case compared to central and eastern European countries. For the central and eastern European countries, programmes that support linkages only account for on average 8 percent of total reported budgets. This relatively low deployment of instruments to support linking can be related to the weak performance of both the public and the private R&I sector in these countries, especially the poor quality of their public research systems (Table 2). Having effective public-private linkages will require first increasing the quality of both public and private research, before linking them.
For the category ‘other’, although it is small residual category in all groups of countries, there are substantial differences between member states. An outlier is Estonia, one of the innovation-following central and eastern European countries. Estonia reports spending 44 percent of its R&I budget on support for venture capital, one of the other instruments. This correlates with the star performance of Estonia on the finance component of the IUS indicator, for which Estonia has the highest score among all EU countries, even higher than the innovation leaders.
Overall the analysis shows that the mix of instruments for innovation policy deployed by EU member states is a rather standard set of instruments, with most countries deploying a similar mix of bread-and-butter policy instruments, focused mostly on supporting investment by firms, irrespective of the innovation capacity development level of the country
4. Matching innovation-policy deployment and innovation-capacity development: the case of programmes supporting investment by firms
To better understand how differences in innovation-policy deployment interact with differences in performance on innovation capacity, we further zoom in on the IUS component of investment by firms in R&I. Most EU countries concentrate their reported R&I budgets on this area. It is also the area for which Europe on average scores relatively weakly compared to global competitors such as the US. Within the EU, it is the area most marked by a high and persistent divide, in particular a considerable gap between leading and lagging countries. However, as we have shown, despite this divide in performance in this area, there is a remarkable relative similarity in innovation policy deployment.
In Figure 1 we examine whether countries that score well in terms of investment by firms in R&I also spend a large share of their public R&I budgets (over the period 2004-12) on supporting investment by firms in R&I (over the period 2006-12). The intention is not to establish causation, but to provide a bird’s eye view on correlation.
Figure 1: Investment by firms in R&I and public spending on instruments to support investment by firms: country scores
Source: Bruegel on the basis of TrendChart and Innovation Union Scoreboard 2014 Database.
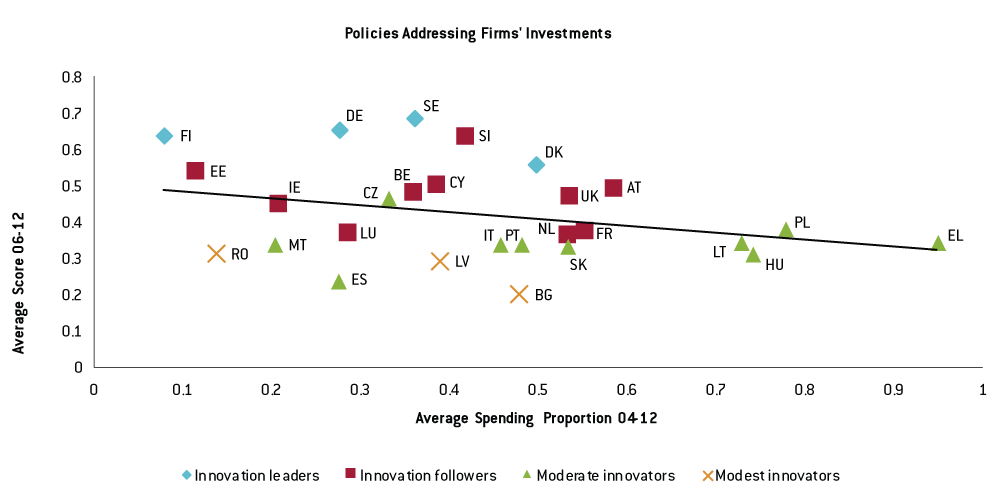
Figure 1 shows no clear correlation between public spending and EU countries’ IUS scores in terms of R&I investment by firms. The innovation-leading countries are the best scoring EU countries on R&I investment by firms (together with Slovenia and Estonia), but they spend a relatively small part of their total reported budgets on support for investment by firms. The countries that concentrate more of their innovation policy budgets on stimulating investment by firms in R&I, such as Poland, Lithuania, Greece and Hungary, have relatively low performance scores in this area. Overall, Figure 1 suggests that countries that score weakest for R&I investment by firms spend the most on supporting R&I investment by firms. The converse also seems to be the case: those that spend least perform best. This is suggestive of the deployment of this group of instruments in order to address country weaknesses.
But can any conclusions be drawn on whether the deployment of larger spends to support R&I investment by firms is associated with improvements in the performance of countries on this measure?
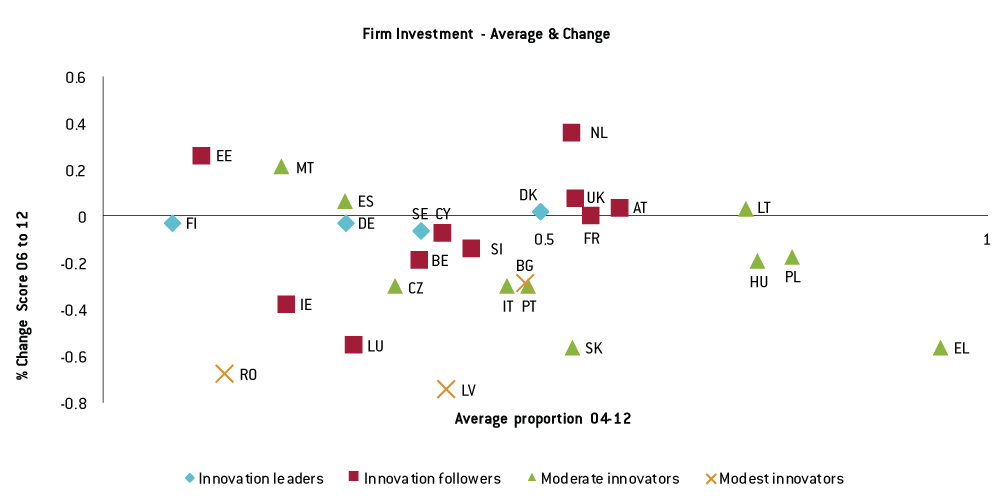
Figure 2 plots the average reported spend on R&I investment by firms against the change in IUS scores for that component over the period 2006-12. Again it shows no clear pattern. Countries that have consistently spent a substantial part of their R&I budgets on investment by firms do not necessarily consistently improve their scores for this IUS component. Countries such as Greece, Poland and Hungary are even regressing. A positive outlier is the Netherlands, which spends a consistent large share of its reported R&I budget on support for investment by firms, while managing to considerably improve its IUS score for this measure. Estonia has also managed to increase its IUS score, but with only a small part of its budget allocated to supporting investment by firms. This can be correlated with its heavy emphasis on supporting venture capital, as a complementary support scheme for firms to ease their financial constraints when investing in R&I. This shows that it is necessary to look at the whole mix of countries’ innovation policy instruments in order to assess their impact on innovation performance.
Figure 2: public spending on instruments to support investment by firms and subsequent changes in country scores on investment by firms in R&I
Source: Bruegel on the basis of TrendChart and Innovation Union Scoreboard 2014 Database.
5. Summarising and concluding policy implications
The challenges for innovation policy in Europe are huge. The EU continues to suffer from an innovation-capacity gap relative to other major world economies, and the pace of catch-up is very slow. The EU’s slow overall improvement in innovation performance can be related to a growing innovation-performance divide between its member states. There are substantial differences between EU member states in terms of their innovation capacities. The divide between the innovation leaders in the north and the innovation laggards is proving very persistent. The process of convergence, which was already very slow before 2008, has since stalled, and has more recently moved into reverse, especially in terms of the inability of the southern EU countries to catch up.
Among the various components of innovation capacity, Europe’s weakest spot is investment by firms in R&I. This is also the innovation-capacity component for which the divide between innovation-leading and lagging member states increased substantially between 2006 and 2013. As the business sector is responsible for the persistent R&D intensity gap between the EU and the US and Asia, the persistent failure of lagging EU countries to catch up in this area provides much of the explanation for the EU’s slow pace of catching up with other economies.
On the quality of the public research system, despite overall EU improvement relative to the US, the differences within the EU, despite slow convergence, remain substantial. While excellence in public research may always be more geographically concentrated – as it is in the US – what matters more is how this excellent research is shared with the private sector, underpinning corporate innovation. However, in terms of linkages between the public and private sectors, the divide between EU member states is substantial and has increased over time.
The innovation divide is not a simple east-west division. Estonia and Slovenia outperform other central and eastern European countries. There is a strong and even more persistent north-south divide. While the central and eastern European countries have caught up on most components of innovation capacity, the gap between them and the innovation leaders is widest in terms of the quality of public research systems. This gap is only slowly narrowing. For the southern EU countries, the biggest shortfall compared to the innovation leaders is for finance as an enabler, with very little catching up evident in this area.
Although all innovation-leading countries are in low fiscal consolidation mode, and all countries in high fiscal consolidation mode are innovation laggards, the innovation divide is not a simple divide between low and high fiscal consolidation countries, because there is also a growing divide between high fiscal consolidation countries in terms of innovation capacity performance.
Since the crisis, the divide between EU countries in public spending on R&I relative to GDP has increased. The innovation-leading countries have forged ahead but the followers have not been able to keep up, leaving a wider gap in public R&I spending now than before the crisis. This is the case for high fiscal consolidation innovation-lagging countries, but even within this group there is a growing divergence, with Portugal, for example, improving while its neighbour Spain loses ground.
When looking at the various innovation policy instruments deployed by EU countries, the evidence shows that despite the wide and growing divide in innovation capacity performance, member states deploy a relatively similar mix of policies. Most EU member states dedicate the major part of their resources to schemes to support investment by firms in R&I. The type of support that most differentiates innovation-leading countries from other EU member states is their significantly greater deployment of policy instruments that support linkages in innovation between the public and private sectors.
Overall, the innovation policies that have been deployed do not seem to have been able to address the growing innovation divide in the EU. The evidence suggests that policy mixes are the outcome of a variety of factors and only one of these seems to be a country’s innovation capacity level. Other factors might include policy fashions and perceptions of one-size-fits-all approaches to innovation policy. A risk for the EU might be looming in this respect. Exercises such as the preparation and comparison of National Reform Programmes and the European Semester might drive EU countries’ innovation policies too much in the same direction (Todling and Trippl, 2005). Innovation policy in EU countries with lower innovation capacities, and that are in catch-up mode, should not just be an imitation of practises in innovation-leading countries.
We have only looked at innovation policies deployed by member states, which spend most of public money that is available in the EU for R&I. However, there is a complementary role for the EU to help close the innovation divide. In terms of budgets, Horizon 2020, and perhaps even more so the Structural and Investment Funds, can be used to complement spending by member states, especially in countries in high fiscal consolidation mode. Beyond provision of public funding, the Europe 2020 strategy and the European Semester exercises can provide a forum for improved governance of the mix of innovation policy instruments deployed by member states. While the EU can provide a forum for exchange on innovation policy, the adoption of policy instruments should adapt to local requirements. The Europe 2020 strategy should not be thought of as a harmonisation process.
The lack of correlation between innovation policy deployment and improvements in innovation capacity (Figures 1 and 2) calls for a more in-depth evaluation of innovation policy deployment by EU member states, in order to better understand how to tailor innovation policy mixes to local needs. The way forward for improving innovation policy in Europe is better analysis and diagnosis to guide policy design ex ante, more experimentation with new instruments and combinations of instruments, and better evaluation ex post.
Only if the EU understands and addresses the failure of its lagging members to catch up and its growing internal innovation divide, will it be able to achieve its ambition of becoming a world innovation leader.
About the authors
Related content

The comparison between the European and American innovation systems is hardly encouraging for Europe

Promoting STEM skills: a brief assessment of French individual learning accounts
French ILA successfully promotes basic digital skills but falls short of fostering more advanced capabilities.

Green Industrial Policy in Europe: Past, Present, and Prospects
