Preparing for the next winter: Europe’s gas outlook for 2023
We explore in detail the two pillars of energy security: LNG supply and the nature and volume of natural-gas demand reductions.

Executive summary
The European Union has so far weathered the energy crisis brought on by Russia’s invasion of Ukraine in February 2022 and will manage winter 2022/23 even if Russia abruptly halts all pipeline gas flows. However, preparations must be made for winter 2023-24. In particular, gas storage facilities should be 90 percent full by 1 October 2023.
We assess the demand reduction needed if the 90 percent storage target is to be achieved. Our assessment takes into account EU imports, exports to refill gas storage facilities in Ukraine and Moldova, the weather and the situation in power markets, where gas demand is highly dependent on non-gas energy sources. Assuming limited Russian exports continue, and weather conditions are typical, demand up to 1 October 2023 must remain 13 percent lower than the previous five-year average. The EU should therefore extend its demand-reduction target, which is currently set to expire on 31 March 2023.
Two variables will determine how easily the target can be met: 1) liquified natural gas (LNG) supply, and 2) the nature of demand reductions. Plans for rapid deployment of regasification units will alleviate concerns over LNG import infrastructure capacity. However, the EU will continue to compete internationally for LNG cargoes, and will remain vulnerable to global dynamics. Strong economic growth in China, for example, could further tighten markets.
The way demand is reduced will determine the economic consequences. So far, large reductions in industrial gas demand have not been accompanied by dramatic drops in industrial output, suggesting good substitution options. However, hardly any gas was saved in the power sector last year, because of weak nuclear and hydro output. The return of French nuclear output will therefore be a huge positive. Finally, households have reduced gas demand, partly driven by warmer than usual weather. Record numbers of heat pumps were deployed in 2022, suggesting the start of a structural shift away from gas demand for heating.
Policy should support a continued structural shift away from gas. This involves enabling rapid deployment of renewables and the accompanying grid infrastructure, energy-efficiency measures, help for households that want to switch to cleaner heating, and collaboration with industry to accelerate adoption of new low-carbon production methods.
1 Introduction
The European Union spent most of 2022 in crisis mode over energy. Russia’s invasion of Ukraine and the subsequent reduction in Russian gas exports to Europe pushed prices to previously unimaginable highs, causing pain for businesses and households. To its credit, the EU’s response has remained resolute. The crisis has so far been weathered through swift decision-making, fuel switching and rapid adjustments facilitated by a strong market framework, which has seen the rapid ramping up of liquified natural gas (LNG) imports and reductions in domestic demand.
Attention now turns to planning for the next winter. We provide an updated analysis of the EU’s situation, with a particular focus on what must be done to ensure filling of gas storage facilities ahead of the 2023-24 winter. We explore different scenarios taking into account the volumes of gas which the EU receives from Russia, the weather and the situation in power markets, where gas demand is highly dependent on non-gas energy sources.
We explore in detail the two pillars of energy security: LNG supply and the nature and volume of natural-gas demand reductions. In relation to LNG, plans for rapid deployment of regasification infrastructure are set to alleviate concerns about import infrastructure capacity. These plans must be implemented, however. A further concern is competition for limited LNG on global markets. Meanwhile, demand reduction in the EU during the first half of the winter of 2022-23 has been very substantial. Helped by warmer than usual weather, it has contributed to a significant drop in prices. We evaluate exactly how this was achieved, with a focus on possible economic consequences. A firm conclusion is that the EU should extend its demand reduction target to at least October 2023.
2 By how much must demand be reduced?
EU countries in August 2022 agreed a target to reduce natural gas demand by 15 percent between 1 August 2022 and 31 March 2023, compared to the average of the same period in the previous five years[1]. With this reduction, the EU can manage to meet demand during winter 2022-23, even without any Russian gas (McWilliams and Zachmann, 2022a). However, Europe’s energy crisis will not be over in April 2023.
Decisions should be taken already with winter 2023-24 in mind. An EU gas-storage regulation requires volumes to reach 90 percent of capacity (1,007 TWh) by 1 October 2023[2]. We calculated the required demand reduction for the EU to achieve this target, beginning with storage at 71 percent full (800 TWh) on 1 February 2023.
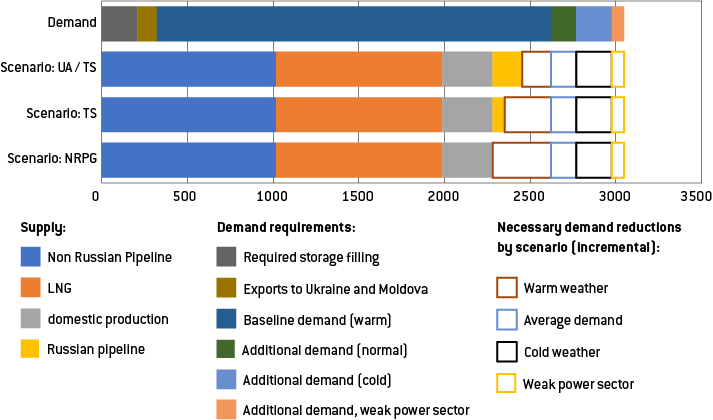
We explore three scenarios (Table 1):
- A baseline in which Russian pipeline gas flows remain roughly at today’s levels, with gas arriving via Ukraine transit and the Turkstream pipeline (UA/TS scenario; these are the two remaining delivery routes for Russian gas to the EU after deliveries to the Baltic States, via the Yamal pipeline, and via the Nordstream pipeline, were stopped between April and September 2022). Turkstream (TS) flows are predominantly to Hungary passing through Serbia, while Ukraine transit gas passes through Slovakia, Austria and Italy.
- A scenario in which only Ukraine transit flows are halted but Turkstream flows continue. For political reasons we consider Turkstream flows to Hungary the least likely to be scrapped.
- A scenario with no Russian pipeline gas (NRPG).
In all scenarios, non-Russian pipeline and LNG flows are assumed to continue at the daily average rate in 2022, when the EU secured record LNG volumes (see section 3 for more discussion of this assumption; see also the annex). We calculated the demand reduction needed as a percentage of the average demand from February to October in the previous five years, in the same way as the EU’s 15 percent demand reduction target was calculated[3].
In the UA/TS scenario, the EU would need to reduce gas consumption by 13 percent (320 TWh) relative to the previous five-year average. If Ukraine transit is halted, this reduction requirement increases to 17 percent (420 TWh), and to 20 percent (490 TWh) if all Russian pipeline gas is halted[4]. Temperature variations would require higher or lower reductions (Figure 1 and Table 2).
Figure 1: EU estimated gas balances 1 February 2023 to 30 September 2023
Source: Bruegel
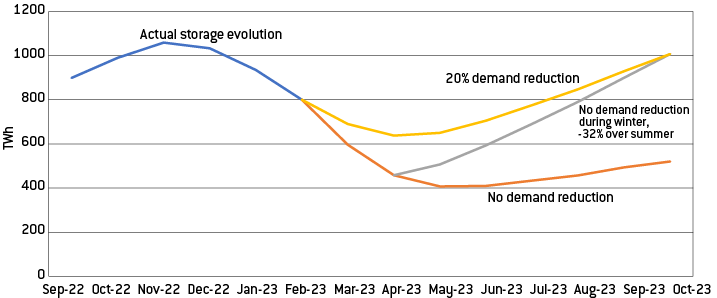
Figure 2 shows the evolution of stored gas in the most dramatic NRPG scenario. With no further demand reduction, the EU could manage winter 2022/23 with a buffer of 400 terawatt hours or 35 percent of storage capacity. But the consequence would be a need for a 32 percent reduction during summer 2023 to refill storage facilities. Meanwhile, with the required 20 percent reduction, storage volumes will not drop below 55 percent before the end of winter 2022/23. The same logic applies for the other two scenarios. Policy should ensure that the temptation to run down storage volumes during winter 2022-23 does not prevail. Otherwise, summer 2023 will likely see a return to very high gas prices as storage is refilled – a repeat of the energy price spikes in August and September 2022.
Figure 2: Projected EU gas storage volumes in NRPG scenario
Source: Bruegel.
2.1 Regional effects: must demand reductions vary by geographical area?
Infrastructure bottlenecks have been a defining feature of Europe’s energy crisis. Thanks to several developments, however, physical bottlenecks are gradually becoming less severe. First, some planned infrastructure projects have come online over the past few months, including the Baltic Pipe taking Norwegian gas to Poland, and interconnections between Poland and Slovakia, Bulgaria and Greece, and France and Germany (reverse flow). Without the crisis, some of these might not have happened so quickly, if at all. Second, the rapid deployment of floating storage and regasification units (FSRUs), particularly within Germany, is set to provide additional LNG import capacity in strategically important geographies (Figure 3).
Figure 3: New gas infrastructure, September 2021 to October 2022
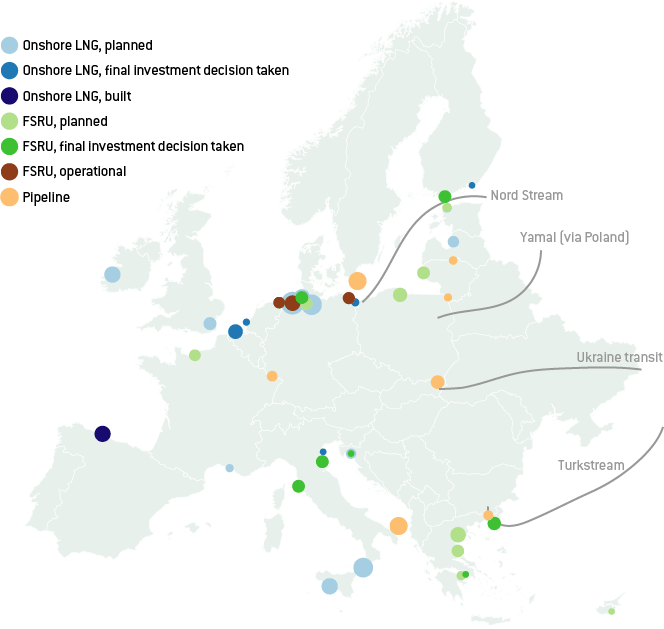
Source: Bruegel. Note: FID = final investment decision.
Third, and importantly, EU storage facilities are at the beginning of 2023 unusually full. Storage volumes are unlikely to be fully depleted by the end of winter. Beyond having gas in reserve, a positive consequence of this is that full storage facilities provide a buffer to the gas grid, meaning that domestic demand on any given day can be met by a combination of production, imports and storage withdrawal. This relaxes imports constraints and should lead to lower prices (Takácsné Tóth et al, 2022).
As a consequence, national gas markets are now more tightly connected than they were in 2022. This means that changes in demand and supply in one country have greater spillovers across the EU: higher consumption in one country will draw away gas from neighbouring countries. Conversely, demand reductions will help the EU in the aggregate, regardless of where they occur. This contrasts with the situation in early 2022 when plausible arguments could be made that reducing demand in particular areas did not help eastern European countries because of infrastructure constraints. In 2023, reductions in Spanish imports of LNG for power generation will free up global LNG availability, lack of which would otherwise put limits on European supply. The Netherlands is more able to reduce European gas prices significantly by boosting output from the Groningen gas field. The Dutch would be able to lower their LNG imports, while increasingly passing gas through to Germany via pipelines that will no longer be operating at maximum capacity. These examples highlight that there continues to be a strong case for a ‘grand bargain’ to be struck between EU leaders, trading off national advantages for the benefit of the whole EU (McWilliams et al, 2022). More tightly connected markets mean that the argument for joint LNG purchasing and agreements on industrial and household subsidies, and possibly for a common EU Energy Fund (Tagliapietra et al, 2022), is even stronger than it was in 2022.
3 Will the EU be able to continue record LNG imports?
In 2022, European LNG imports increased by 600 TWh or 60 percent of total 2021 imports, with 400 TWh of the additional volumes coming from the United States (Figure 4). This was largely facilitated by a redirection of global LNG flows attracted by Europe’s willingness to pay higher prices. Chinese imports fell by 200 TWh. Meanwhile global LNG exports grew by just under 5 percent, by 230 TWh.
Figure 4: Changes to LNG imports for selected regions and global export growth, 2022 versus 2021
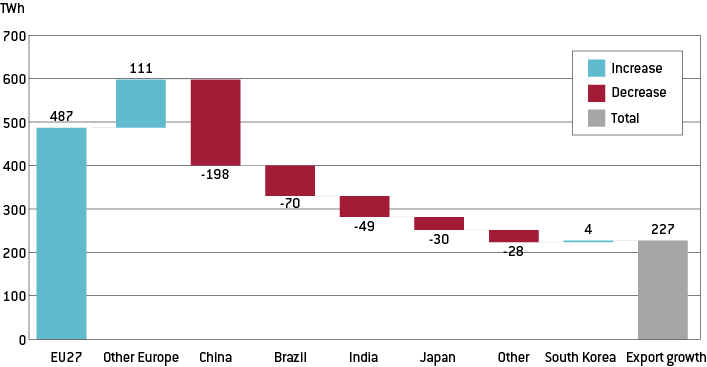
Source: Bruegel based on Bloomberg.
In recent years, US LNG liquefaction capacity was mostly contracted by Asian importers. In 2022, the US was able to run it almost at full capacity (except for certain facilities during the hurricane season). In 2022 part of the LNG contracted in the US by Chinese importers was redirected to Europe. This was possible because of increasing supplies of pipeline gas from Russia to China (via the Power of Siberia pipeline, flows through which increased from 10 billion cubic metres in 2021 to 15 bcm in 2022), slower Chinese economic growth and fuel switching (from gas to coal or oil). Whether Europe can continue to rely on these volumes depends on China’s fuel-switching ability and its economic growth. Following the ending of China’s COVID-19 restrictions, Chinese growth is projected to rise above 5 percent[5], almost twice the 2022 rate.
Ultimately, prices are the arbitrator between markets. The EU was able to import so much LNG because it was willing to pay high prices. Certain Asian markets are particularly sensitive to global LNG prices. High prices drive fuel switching, possibly freeing up LNG for Europe. US, Asian and European gas markets are all sensitive to temperature, and LNG is commonly used to absorb demand variations in all three markets. If the winter is not cold in all three markets at the same time, some LNG can be diverted from regions with mild weather to regions experiencing a harsh winter.
Russia is still exporting 10 TWh to 15 TWh per month of LNG to the EU. This is not subject to sanctions but could be cut by Russia. Future LNG liquefication projects in Russia are likely to be delayed because of sanctions on imports of technical equipment.
Finally, the global LNG market will continue to see steady growth in 2023, expanding by somewhere between 200 TWh and 300 TWh (IEA, 2023). Figure 5 visualises the minimum and maximum imports by the main regions and countries from 2019 to 2022, and compares that against expected 2023 supply (2022 supply plus 2023 growth). With weak extra-EU demand, there will be sufficient capacity for the EU to increase its LNG imports even more, whereas with strong extra-EU demand, global LNG competition and prices will remain tight throughout 2023.
Figure 5: Global LNG, range of expected demand vs expected supply, 2023, TWh

Source: Bruegel.
4 Demand reductions: how and by whom?
In 2022, the EU reduced gas demand by approximately 500 TWh, or 12 percent of the 2019-21 average (McWilliams and Zachmann, 2022b). Gas demand for power generation fell 2 percent, while industry and household demand together fell by 15 percent.
The social and economic consequences of lower gas consumption depend on how gas demand is reduced. At one end of the spectrum, warmer temperatures lead to easy reductions; at the other, saving gas by closing factories can lead to severe disruptions. Here, we explore the scope for demand reduction through various channels, to give a sense of how aggregate demand reduction targets could be met in the least painful way.
4.1 Buildings (households)
Gas consumed in the buildings sector is overwhelmingly for heating, and as such demand is both highly seasonal and influenced by weather variations. Temperature deviations are a key parameter for determining the necessary reduction compared to a ‘normal winter’.
Using temperature and daily demand data from 2021, we estimated a relationship between temperature and gas demand for a group of countries covering 80 percent of EU gas demand[6]. The calculations suggest that gas demand from February to October 2023 will be 9 percent (210 TWh) higher if the weather is as cold as the coldest it has been over the last ten years, and 6 percent (150 TWh) lower if the weather is at warm as the warmest it has been over the last ten years. By adjusting baseline demand to this, we calculated that historically cold-weather demand would have to be reduced by 20 percent and historically warm-weather demand by 7 percent, assuming Russian flows continue at today’s levels. That compares to 13 percent with normal-weather demand. In case of no Russian flows, gas demand would have to be reduced by 26 percent (cold weather) or 15 percent (warmer weather).
Beyond responding to temperatures, households can reduce demand through a range of behavioural and structural changes. Households respond both to higher prices and to government requests to save energy (though these requests from EU governments have not been forceful). In October and November 2022, household gas demand was around 30 percent below average across a range of EU countries, exceeding reductions that would have been expected based on weather alone.
More structurally, EU households are purchasing and installing heat pumps at a record pace. Market trends suggest that the record number of installations of 2.2 million heating units in 2021[7] will be far surpassed in 2022. For example, the Polish heat-pump market grew by 121 percent year-on-year in the first three quarters of 2022. In 2022, heat pump sales grew 53 percent year-on-year in Germany. With conservative assumptions[8], we estimate that the deployment of heat pumps alone will reduce EU gas consumption in 2023 by 20 TWh, or 0.5 percent of total gas consumption.
4.2 Power sector
Problems with French nuclear production, and weak hydro output on the back of the very dry summer in 2022, meant little to no gas could be saved in the power sector. Without these issues, which saw a reduction in electricity generation of over 120 TWh compared to 2021, significantly more gas could have been saved in the power sector in 2022.
In our baseline scenario, we assume French nuclear (which ramped up significantly at the start of 2023) and Italian/Spanish hydro output recover to their five-year averages. ‘Weak power’ describes a scenario in which both French nuclear and Italian/Spanish hydro output remain at 2022 levels. We convert the shortfall in electricity demand to gas demand, assuming 50 percent gas-fired power efficiency and gas-peaker plants running 35 percent of load hours to compensate for French nuclear, and 80 percent for EU hydro (dominated by Spain and Italy).
If French nuclear does not recover to its five-year average during February to September 2023, gas demand will be increased by 43 TWh, while if Spanish and Italian hydro output does not recover, a further 29 TWh of gas will be consumed. In sum, another period of both weak nuclear and hydro would require an additional 2 percent of gas demand to be reduced elsewhere.
Beyond these factors, ramping up the deployment of renewable energy sources continues to be essential. In 2022, the EU added a record amount of renewable capacity. This record looks set to be broken again in 2023.
4.3 Industry
Industrial value chains use gas to produce final products. Gas is either a feedstock, and is chemically transformed, or an energy source – combusted to generate process heat. The implications for final industrial production of industry reducing its gas demand depend on whether industry can substitute gas and continue production, or whether gas shortages imply full closures of industrial plants and lost jobs.
A simple method for monitoring the effects is to track industrial production. Overall, gas supply issues so far have not affected industrial output at the aggregate country level (Figure 6), while certain countries and sectors have been affected.
Figure 6: Total manufacturing industrial output by country
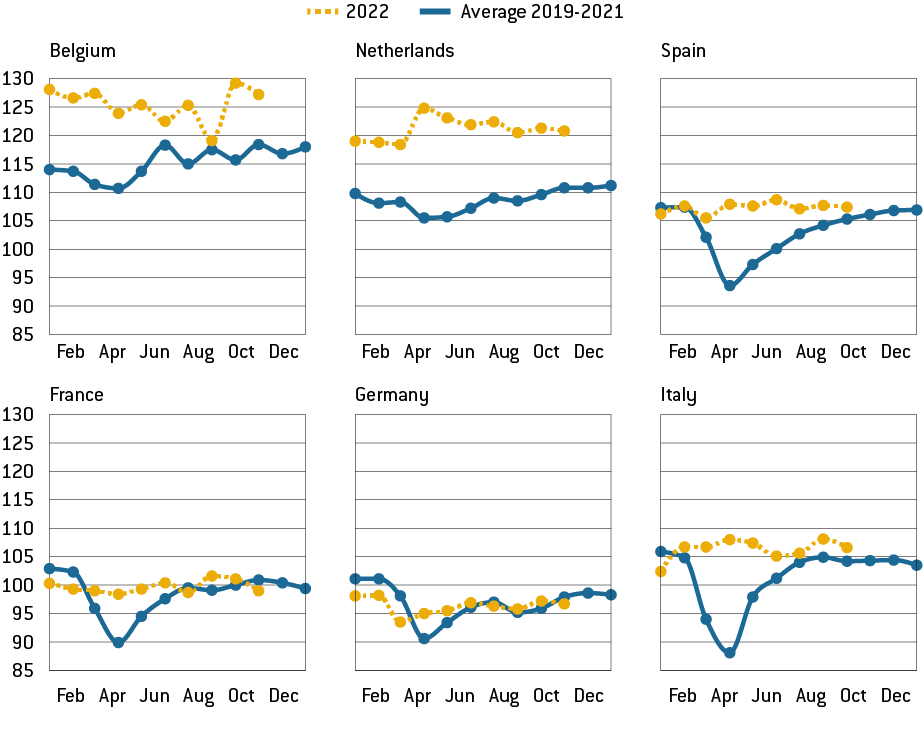
Source: Eurostat. Note: index, 100 = 2015 average.
Small effects at the aggregate level are not surprising given that the four largest gas-consuming industrial classifications in the EU consume 74 percent of industrial gas supplied, while accounting for 26 percent of manufacturing jobs (Table 3).
Yet, in many cases, even within these sectors the effects are muted (Figure 7). There are several possible reasons for this. Producers can substitute gas for other fuels. For instance, furnaces can be heated with light heating oil instead of gas. The International Energy Agency estimates that, of the industrial gas demand reduction in 2022, around half was achieved by fuel switching (IEA, 2023). High prices also encourage incremental energy-efficiency improvements. The largest reduction in output has been from the chemicals sector, where natural gas is typically used as a feedstock and is more difficult to substitute.
Figure 7: EU27 manufacturing output by sector
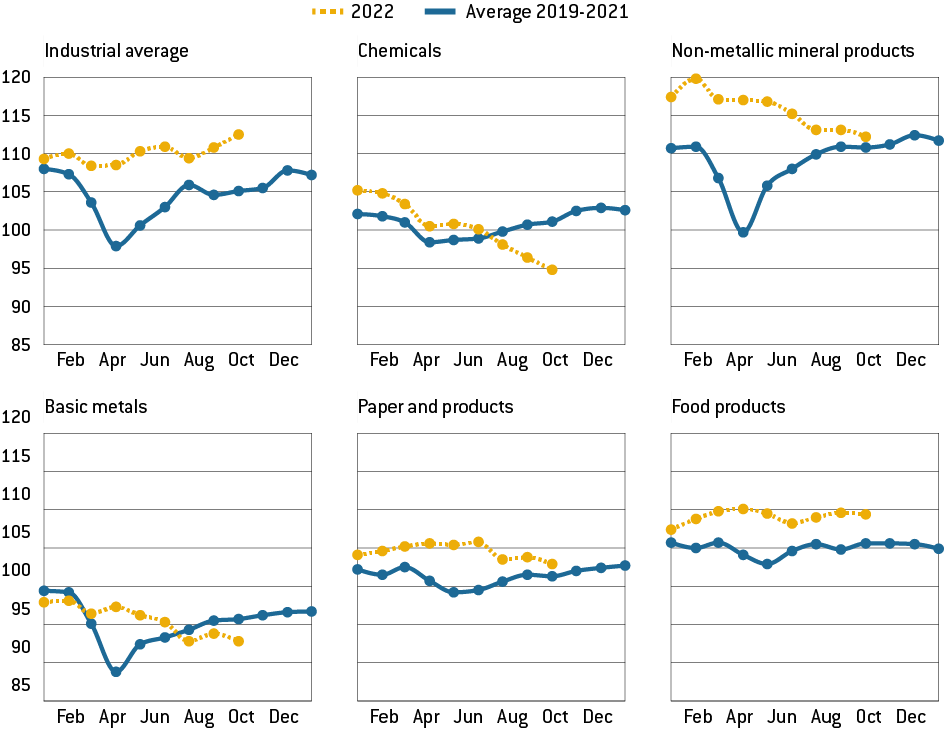
Source: Eurostat. Note: Index 100 = 2015
Substitution is also possible through imports. Global value chains allow for the substitution of only the primary stage of a value chain. European industry should therefore have been able to shift toward importing gas-intensive primary products, displacing this gas demand domestically whilst retaining the subsequent and higher value-added stages of production. Mertens and Müller (2022) found that if Germany were to import products with high gas intensity and import substitutability, industry could reduce gas demand by 26 percent, while losing only 3 percent of final sales. From its plants in the US, BASF is able to increase imports of ammonia, which can then be used to manufacture fertilisers in Europe[9]. Analysis shows the flexibility of the fertiliser industry in responding in this manner without harming domestic fertiliser output (Clemens et al, 2022).
The data suggests that industry is reducing gas demand successfully without substantially impacting industrial output or employment. Three-quarters of German firms have said they have cut back on natural gas consumption, with only minor impacts on production[10].
5 What can be done? No-regret options
An unusually warm winter, the bringing back online of French nuclear plants, weak Chinese energy demand, and the absence of negative surprises on global LNG markets and in terms of European pipeline supplies, have eased substantially the European gas supply-demand balance. However, while prices have receded from record highs, they remain three or four times higher than their typical range over the past decade. Europe’s gas supply-demand balance will remain a tightrope walk for the next two years. There is very limited redundancy remaining in the system to compensate for any non-Russian supply risk that might occur. Policymakers must continue to take strong and decisive action. We outline a set of priority areas.
First, planned FSRUs should be installed and begin operations according to promised timelines. Second, imported gas – largely LNG – must be secured. Questions arise about the volume of long-term contracts that European companies should sign for LNG, and the role for governments in facilitating such deals. New long-term contracts do not necessarily undermine climate goals. In 2021, EU countries had long-term contracts with Russia with a nominal capacity of 100 bcm/annum, extending to 2030 (ACER, 2022). Most of these are now redundant. As gas demand is set to decrease more quickly than expected in the EU, not all this capacity should be replaced with new long-term contracts, but limited volumes may be necessary. Any contracts must respect the EU’s climate goals and be concluded before 2049.
Our scenario analysis shows that regardless of Russian flows, it is essential for the EU to continue reducing demand until October 2023. Under normal weather conditions, the required reduction ranges from 14 percent to 20 percent, depending on Russian pipeline imports. At a minimum, the EU should agree to extend its 15 percent demand reduction target from March until October 2023. Furthermore, efforts should continue to ensure that demand reduction is structural and comes with minimum economic damage. Rapid renewables deployment, electrification of heating and energy efficiency can all be accelerated to reduce the demand-reduction burden, which must be shouldered by industrial curtailment. Government campaigns should continue to inform citizens on the importance of saving energy, and how to do so with as little impact as possible on household welfare.
Subsidies for gas consumption will continue to cause tensions while absorbing substantial fiscal resources. Improving the position of individual consumer groups on the market will remain a zero-sum game as long as supply is tight. Providing certain consumers in one European area or sector access to cheaper gas implies making gas more expensive for all other consumers. Governments should phase out subsidies in a coordinated manner, replaced by agreements at EU level if necessary[11].
Another challenge in a more relaxed market is how to transition from 2022’s emergency regime of storage filling back to a more efficient market-based approach. This might require some European coordination, as otherwise countries that phase-out government interventions too quickly might struggle to attract gas for storage. Joint gas purchasing via the EU’s Energy Platform, with its requirement that countries use it to fill 15 percent of their storage obligations (13.5 bcm in total) is a step in the right direction[12]. As gas storage looks likely to end winter 2022-23 relatively full, the platform might end up being responsible for a substantial share (over 50 percent) of the gas pumped into storage in summer 2023.
A related issue is how to deal with the costs of emergency storage filling and infrastructure. Gas companies or large consumers may now sit on gas that they procured at much higher prices than the current market price, and sales or use of that gas will entail substantial losses.
Finally, for all the analysis of the EU’s success in transitioning away from Russian gas, there are still no EU-level sanctions in place on gas supplies from Russia. Instead, Russia cut flows to the EU. There remains a risk that Russia, after witnessing its broad embargo fail to have the desired effect, will try to selectively increase gas flows to some countries in return for political favours. Many long-term contracts are still in place to facilitate this. Energy weaponisation can work both ways: not only cutting demand, but also sending cheap energy to friends. Such a scenario might seem far-fetched, but it remains legally possible. Despite recently falling gas prices, the EU’s gas situation remains tight and the situation could quickly worsen, depending on events. Gas supplies via the Nord Stream pipeline (destroyed; sabotaged in September 2022) and the Yamal pipeline (highly unlikely to be permitted by Poland) seem unfeasible, but there is potential for increases via Ukraine transit and Turkstream. The EU thus needs to implement quickly a joint policy tool, such as sanctions or joint purchasing, to defuse this risk, and anticipate any future Russian move.
References
ACER (2022) Annual Report on the Results of Monitoring the Internal Electricity and Natural Gas Markets in 2021, European Union Agency for the Cooperation of Energy Regulators, available at https://www.acer.europa.eu/sites/default/files/documents/Publications/ACER_Gas_Market_Monitoring_Report_2021.pdf
Clemens, S., O. Ruhnau and L. and Hirt (2022) ‘European industry responds to high energy prices: The case of German ammonia production’, Working Paper, ZBW - Leibniz Information Centre for Economics, available at https://www.econstor.eu/handle/10419/253251
IEA (2023) How to Avoid Gas Shortages in the European Union in 2023, International Energy Agency, available at https://www.iea.org/news/how-the-european-union-can-avoid-natural-gas-shortages-in-2023
McWilliams, B. and G. Zachmann (2022a) ‘European Union demand reduction needs to cope with Russian gas cuts’, Bruegel Blog, 7 July, available at https://www.bruegel.org/2022/07/european-union-demand-reduction-needs-to-cope-with-russian-gas-cuts
McWilliams, B. and G. Zachmann (2022b) ‘European natural gas demand tracker, Bruegel Dataset, available at: https://www.bruegel.org/dataset/european-natural-gas-demand-tracker
McWilliams, B., G. Sgaravatti, S. Tagliapietra and G. Zachmann (2022) ‘A grand bargain to steer through the European Union’s energy crisis’, Policy Contribution 14/2022, Bruegel, available at https://www.bruegel.org/policy-brief/grand-bargain-steer-through-european-unions-energy-crisis
Mertens, M. and S. Müller (2022) ‘Wirtschaftliche Folgen des Gaspreisanstiegs für die deutsche Industrie’, IWH Policy Notes 2/2022, Leibniz-Institut für Wirtschaftsforschung Halle (IWH), available at https://www.iwh-halle.de/fileadmin/user_upload/publications/iwh_policy_notes/iwh-pn_2022-02_de_Gaspreisanstieg_Industrie.pdf
Tagliapietra, S., G. Zachmann and J. Zettlemeyer (2022) ‘Does the European Union need an energy crisis fund?’ Bruegel Blog, 11 October, available at https://www.bruegel.org/blog-post/does-european-union-need-energy-crisis-fund
Takácsné Tóth, B., P. Kotek, A. Selei and G. Horváth (2022) ‘Europe without Russian Pipeline Gas’, REKK Policy Brief 06 2022, Regional Centre for Energy Policy Research, available at https://rekk.hu/downloads/academic_publications/rekk_policybrief_en_2022_06.pdf
+++
Annex
Scenario assumptions, further details
We assume imports from Norway, Algeria, Azerbaijan and Libya continue at the average daily rate of 2022, as do LNG imports. For LNG imports, we characterise re-export from the United Kingdom to the continent as indirect LNG imports. In Turkstream, we include flows from the Turkstream pipeline to the EU (net of Serbian exports) at their 2022 average. We add Ukraine transit flows based on the daily average from September to December 2022[13] to Turkstream and Ukraine transit. Our scenarios also include an export flow from the EU to Ukraine and Moldova of 23 TWh per month between April and August 2023, to facilitate storage refilling. This assumption is taken from IEA (2023).
In all scenarios, we fix domestic production at 2022 levels.
Temperature adjustments
We accessed daily natural gas demand for 2021 for the following countries: Belgium, Estonia, Hungary, Italy, Luxembourg, Romania, Austria, France, Germany, the Netherlands and Poland. These cover 79 percent of the EU’s 2021 natural gas demand. We accessed average daily temperatures for the capital city in each country via the Python package Meteostat and transformed these into heating degree days. An OLS regression was estimated using heating degree days and a dummy variable for whether a given day is a weekend or holiday. Using the same sources, we averaged heating degree days monthly over the past 10 years and calculated a minimum, average and maximum number of heating degree days over the period under consideration. OLS outputted parameters were then used to calculate average, minimum and maximum demands. We summed this demand and interpreted the range from average to maximum and average to minimum as the effect of a cold or warm period.
Footnotes
[1] See Council Regulation (EU) 2022/1369, available at https://eur-lex.europa.eu/legal-content/EN/TXT/HTML/?uri=CELEX:32022R1369&from=EN.
[2] See Council of the EU press release of 22 June 2022, https://www.consilium.europa.eu/en/press/press-releases/2022/06/27/council-adopts-regulation-gas-storage/.
[3] When we explore sensitivity analysis based on temperatures, we adjust baseline demand to incorporate changes according to temperature and calculate necessary demand reduction as a percentage of this new baseline.
[4] The analysis does not consider changes in Russian LNG flows to the EU. Russian pipeline flows fell from 135 TWh/month average in 2021, to 31 TWh in November 2022. Meanwhile, Russian LNG flows in 2022 averaged 15TWh/month, slightly more than 10 percent of the EU’s monthly LNG imports. However, the global LNG market is fungible. If Russia were to cut LNG flows to Europe we would expect the market to reshuffle. We therefore do not consider interruptions to Russian LNG flows as a significant challenge for the European market.
[5] See Cynthia Li, ‘China’s Growth Forecasts Raised Into Next Year as Country Reopens’, Bloomberg, 19 January 2023, https://www.bloomberg.com/news/articles/2023-01-19/china-s-growth-forecasts-raised-into-next-year-as-country-reopens.
[6] The methodology is explained further in the annex.
[7] Data made available by the European Heat Pump Association at https://www.ehpa.org/market-data/. Polish data is available at https://portpc.pl/spektakularny-wzrost-sprzedazy-pomp-ciepla-w-polsce-w-pierwszych-trzech-kwartalach-2022-r/, and German data is available at https://www.waermepumpe.de/presse/news/details/waermepumpenabsatz-2022-wachstum-von-53-prozent-gegenueber-dem-vorjahr/#content.
[8] Each heat pump saves an average of 7,000 KWh per year (https://twitter.com/janrosenow/status/1501541106739253249). The growth rate of 2021 is continued, meaning 2.9 million units are installed.
[9] Jonathan Lopez, ‘BASF’s Antwerp, US ammonia output could offset potential shutdown in Germany – bank,’ ICIS, 28 June 2022, https://www.icis.com/explore/resources/news/2022/06/28/10779322/basf-s-antwerp-us-ammonia-output-could-offset-potential-shutdown-in-germany-bank/.
[10] Reuters, ‘German manufacturing companies reaching gas savings limit – Ifo’, 22 November 2022, https://www.reuters.com/business/energy/german-manufacturing-companies-reaching-gas-savings-limit-ifo-2022-11-22/.
[11] The EU’s gas price cap meanwhile, agreed in December 2022, is likely to be more politically than economically significant. The agreed trigger level of €180/MWh, combined with European prices at €35/MWh above the global LNG price, mean the cap is unlikely to be ever activated, given recent tempering of prices and increased LNG regasification capacity. This is good news because the possible effects of an activated price cap would be frightening. Gas trading would cease, as no trader would want to sell below the true price, and how unmet demand would then be met has not been clearly spelled out. The strategic dynamics that could emerge around an artificial price ceiling are difficult to predict, as large players might try to game the system.
About the authors
Related content

European natural gas imports
This dataset aggregates daily data on European natural gas import flows and storage levels.
European natural gas demand tracker

European clean tech tracker
This tracker provides an overview of the main innovation, manufacturing and deployment trends in clean tech in Europe

Beyond the numbers of EU national energy and climate plans
The authors conduct a simple relative frequency analysis for a series of words mentioned in the NECPs to identify interesting policy insights within