European Union countries’ recovery and resilience plans

The Recovery and Resilience Facility (RRF) is the largest component of Next Generation EU (NGEU), the European Union’s landmark instrument for recovery from the coronavirus pandemic. The RRF will provide grants amounting to at most €312.5 billion at 2018 prices, or €338 billion at current prices, and loans amounting to at most €360 billion at 2018 prices or €390 billion at current prices. EU countries have to submit national recovery and resilience plans that describe the reforms and public investment projects they plan to implement with the support of the RRF.
EU countries should have officially submitted their recovery and resilience plans “as a rule” by 30 April 2021 (see paragraph 38 of the Preamble and Article 18(3) of the RRF Regulation). However, this deadline is flexible and the Commission has argued that countries can submit their plans up to mid-2022. Thirteen countries submitted their plans by the 30 April 2021 deadline or at most with a one-day delay. 24 countries submitted their plans by the end of June 2021, while Malta submitted its plan in July 2021, Bulgaria in October 2021, and the Netherlands in July 2022.
Comparing the national plans is challenging, because they present data in very different structures. The number and definition of headline categories and the availability of summary information about sub-categories varies from country to country. Nevertheless, the biggest challenge of cross-country comparison is the definition of non-overlapping spending categories, because a particular investment could support various purposes as defined by the Article 3 of the RRF Regulation, for example green, social and inclusive growth as well as policies for the next generation. In our reading, cross-country comparisons of recovery plans published so far by other researchers do not pay enough attention to the multiplicity of purposes.
The current version of this dataset focuses on planned investment by countries that have submitted their plans. We will update this dataset as remaining countries submit their plans and augment this analysis with a comparison of proposed reforms, also in light of the country-specific recommendations (CSRs) made in the context of the European Semester.
Overall green and digital shares in investment
While not all countries specify the exact green and digital components of sub-categories, every country presents the overall shares of green and digital components which have to reach at least 37% and 20% respectively. We therefore start with the overall comparison of green, digital and other goals in total planned spending (Figure 1) and present more detailed alternative categorisations below.
It is important to bear in mind three caveats concerning the current version of the dataset:
- We do not examine whether spending plans constitute new spending, or cover spending already planned before the pandemic which will now use the RRF money instead of national tax revenue. An analysis of additionality is crucial in assessing the possible economic impact of the RRF.
- We do not examine whether spending declared by the plans as ‘green’ and ‘digital’ complies with the relevant taxonomy defined by the RRF Regulation.
- While ‘green’, ‘climate’, and ‘environmental’ spending have specific definitions, the particular categorisation of national spending lines is not always clear. Hence, we simply use ‘green’ for all kinds of climate and environment-related spending items and do not separate the particular components related to climate change.
With these caveats in mind, Figure 1 compares the green and digital components of the plans. Significant diversity emerges. Countries that receive relatively smaller amounts from the RRF as a share of their GDP presented plans that concentrate on green and digital spending (Germany, Luxembourg and Denmark), while countries that receive larger amounts presented more diverse plans with higher ‘other’ (non-green and non-digital) shares of spending.
Figure 1: Overall resource allocation in national recovery and resilience plans (% of total and € billions)
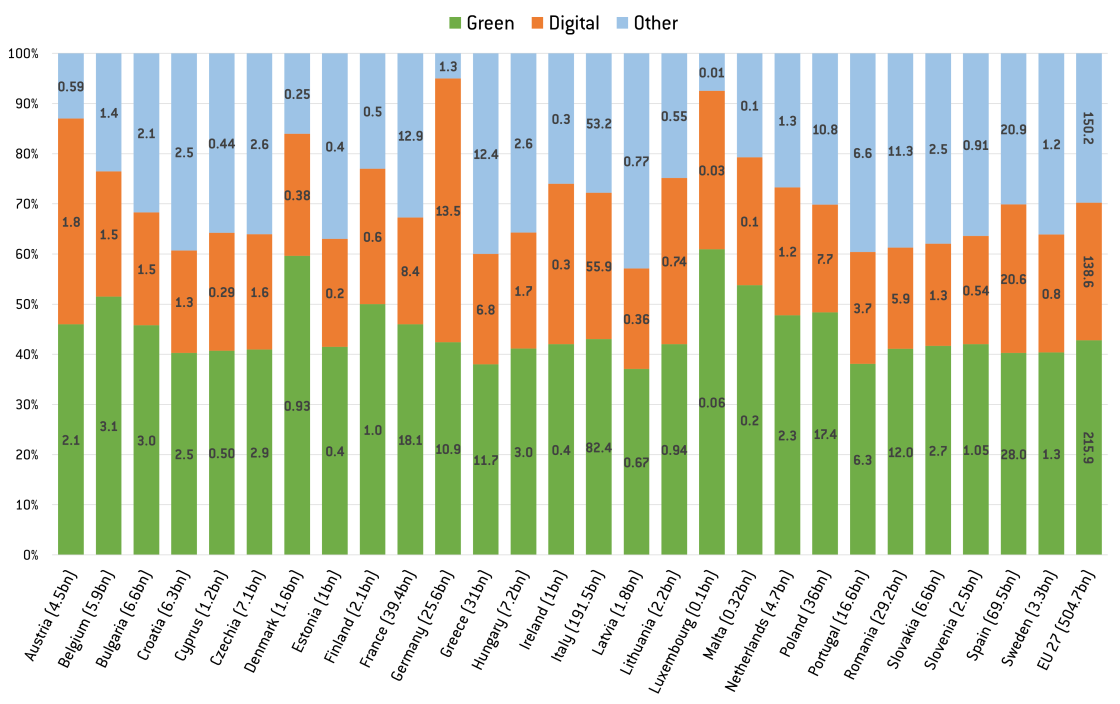
Source: Bruegel based on submitted national recovery plans. Note: the numbers in brackets after the country names indicate the total € amount of the plan to be financed by the Recovery and Resilience Facility, while the numbers over the bars show the € value of the components (in billions). For Italy, both RRF grants and loans are included. Note there is some overlap between green and digital spending, but the level of detail in most national plans does not allow us to properly account for these overlaps. This figure reports the headline green and digital numbers and does not consider their overlaps.
Submission dates, grants and loans requested
With the exceptions of Latvia, all countries requested the estimated full amount of grants or more which were included as indicative amounts in Annex IV of the RRF Regulation (column ‘Estimated RRF grants’ in Table 1). These estimates were based on the Commission’s autumn 2020 forecasts, while the final amounts were calculated on 30 June 2022 using actual data. Any excess request over the maximum amount available for a particular country will be financed by that country.
So far seven countries have requested loans. Of these seven countries Greece, Italy and Romania have requested the full amount of loans available to them, while Cyprus, Poland, Portugal and Slovenia have requested between 16% and 37% of the loans available to them. According to Article 14 of the RRF Regulation, countries can request loan support until 31 August 2023, so more countries may do so.
Panel A of Figure 2 indicates that the cross-country allocation of grants strongly depends on the level of development, suggesting that the RRF could contribute to convergence on the part of poorer countries. Panel B shows that there is practically no association with expected GNI growth from 2019 to 2021, highlighting that the RRF is not really a crisis-alleviation tool.
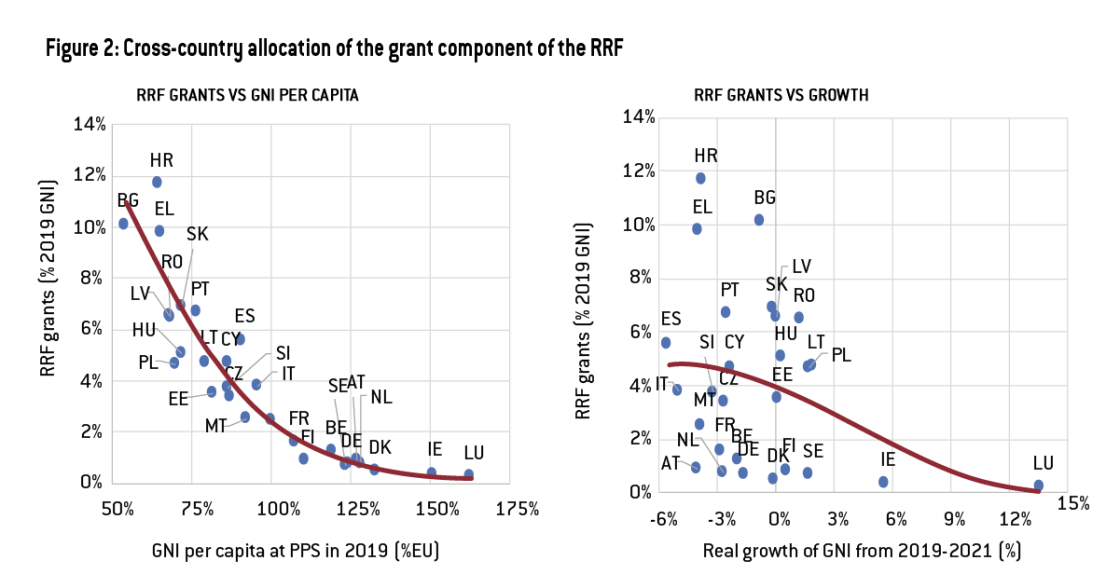
Source: Bruegel based on RRF Regulation (grant allocation in euros), and the spring 2021 Commission forecast (GNI in euros, GNI per capita at purchasing power standards [PPS], and real growth of GNI). Note: the trendline (indicated with dark-red colour) was calculated by fitting a third-order polynomial.
Categorisation of investments according to the RRF Regulation
We compare the spending plans in more detail than the green / digital / other categorisation presented in Figure 1. We use three straightforward classifications for comparing the national plans. Since none of these classifications are ideal (as we explain below), we complemented them with our own classification.
The first classification we use considers the six pillars defined in Article 3 of the RRF Regulation:
- Green transition;
- Digital transformation;
- Smart, sustainable and inclusive growth including economic cohesion, jobs, productivity, competitiveness, research, development and innovation and a well-functioning internal market with strong SMEs;
- Social and territorial cohesion;
- Health and economic, social and institutional resilience, with the aim of, inter alia, increasing crisis preparedness and crisis response capacity; and
- Policies for the next generation, children and youth such as education and skills.
The main problem with this classification is that several pillars overlap. For example, ‘industry decarbonisation’ fosters green transition (1st pillar) and sustainable growth (3rd pillar). ‘Providing digital equipment for teachers’ supports digital transformation (2nd pillar) and education policy (6th pillar). It is also difficult to categorise a programme that aims to subsidise the hiring of disabled people, for example, because that could be labelled as inclusive growth (3rd pillar) or social cohesion (4th pillar), or even as social resilience (5th pillar). Moreover, some of the projects foster both green transition and digital transformation, such as ‘support to aeronautical industry’, though the full amount of a particular heading or subheading is not green or digital. For most investment items, the green and digital components are only partial.
Thus, when using this categorisation, we assigned either one or two pillars to each spending category based on our judgement. When we assigned two pillars (eg 1. green and 3. sustainable growth), a multiplicity of categories emerged, which we report in Table 2 and Figure 3.
Categorisation of investments according to the flagship areas defined by the Commission
An alternative classification is the seven flagship areas for investment and reforms defined by the Commission:
- Power up (clean technologies and renewables);
- Renovate (energy efficiency of buildings);
- Recharge and refuel (sustainable transport and charging stations);
- Connect (roll-out of rapid broadband services);
- Modernise (digitalisation of public administration);
- Scale-Up (data cloud capacities and sustainable processors);
- Reskill and upskill (education and training to support digital skills).
The advantage of this classification is that the overlaps between the seven items are small (although the partial overlap between green and digital projects remains) and each spending item can be placed into a single category with a good level of certainty. The disadvantage is that this classification does not include all green and digital goals and lacks all non-green and non-digital goals like social inclusion or research (if these do not have a green or digital component). We therefore add three additional categories:
- Other green;
- Other digital;
- Uncategorised.
Categorisation of investments according to economic sector
The third categorisation we use is a statistical classification of economic activities from the national accounts dataset, NACE (Nomenclature statistique des activités économiques dans la Communauté européenne). The advantage here is that there is no overlap between the categories, while the disadvantage is that it is not always clear how to categorise a particular spending item. For example, ‘support to small and medium-sized enterprises’ is not sector-specific. We therefore added an ‘uncategorised’ category. Also, some spending items could be related to multiple industries: high-speed trains, for example, includes the building of railway stations (sector F: construction) and the deployment of trains (sector H: transportation and storage). Sufficiently detailed data to disentangle the various industries within a particular spending item is often not available.
Categorisation of investments according to our new classification
Because of the shortcomings of the above-discussed three alternative ways of categorisation of spending, we have developed our own categorisation. Our categorisation aims to offer more granularity in classifying spending while still being able to have aggregate comparisons in more aggregated categories. We thus classify spending in three main categories, which are divided into several subcategories.
Green transition:
- Biodiversity (includes land restoration, marine and maritime)
- Air and water quality (includes sewage)
- Circular economy (includes waste management)
- Climate change adaptation projects
- Green tech innovation
- Renewable energy sources (includes wind and solar, and alternative fuels)
- Buildings’ energy efficiency
- Non-building energy efficiency (eg machines, production processes)
- Hydrogen
- High speed trains
- Public transport
- Other sustainable transport infrastructure (excludes highways and roads)
- Electric mobility (charging stations and vehicles incentives)
- Electricity grids
- Sustainable agriculture
- Green tax incentives
Digital transformation:
- Connectivity
- Digital-related investment in research and development
- Digital skills and digital inclusion
- Digital public sector
- Digitalisation of businesses
- Investment in digital capacities and deployment of advanced technologies (includes cybersecurity)
- Greening the digital sector (energy efficiency of data centres and networks)
Social, economic, and institutional development:
- Economic, social and territorial cohesion
- Labour market and job creation
- Strengthening of the financial system
- Infrastructure investment
- R&D and innovation (non-green and non-digital)
- SMEs
- Health
- Crisis preparedness and resilience
- Justice and combating corruption
- Education and skills (non-digital)
- Culture and tourism
- Sports
Uncategorised
- Uncategorised
Even in our classification, there is overlap between some of spending items, which is especially significant for the plans with insufficiently detailed information. To account for overlaps, we allowed each spending item to have a main and a secondary sub-category. Accounting for all the possible combinations, we ended up with the hybrid main categories that are shown in the table and chart below.
Time profile of planned spending
Surprisingly, only a few countries presented an annual breakdown of planned spending in their recovery plans, while Spain provided the annual breakdown in its 2021 Stability Programme (Table 4.3.2 on page 79).
The European Commission's assessments of the recovery and resilience plans
The Commission should assess the proposed recovery and resilience plans within two months of their official submission and make a proposal for a Council implementing decision (Article 19 and Annex 5 on ‘Assessment guidelines for the Facility’ of the RRF Regulation). The assessment is based on eleven criteria (see their list in the header of Table 6, while the detailed description is presented in Annex V of the RRF Regulation).
Nine of the eleven categories are rated on a scale of 3, with rating A when a criterion is met to a large extent, B when it is met to a moderate or medium extent, and C when it is met to a small extent. Exceptions are the criterion on ‘do not do significant harm to the environment’ (criterion 4) and ‘preventing corruption, fraud and conflicts of interest’ (criterion 10), which are rated either A or C. The Commission’s assessments are available here, while Table 6 displays the ratings.
Among the 27 plans, 24 obtained exactly the same score (10 A ratings and 1 B rating), while Belgium and Estonia got 9 A ratings and 2 B ratings and Czechia 8 A and 3 B ratings. Thus, the Commission assessed these plans very positively.
For ‘cost justification’ (category 9), all 27 countries obtained a B rating. This means that according to the Commission, “The justification provided by the Member State on the amount of the estimated total costs of the recovery and resilience plan is reasonable and plausible and is in line with the principle of cost efficiency and is commensurate to the expected national economic and social impact” is met only “to a medium extent” by all EU countries.
Some or more of the arguments below were listed to justify the medium rating:
- cost breakdowns show varying degrees of detail and depth of calculation;
- there are some gaps in the information and evidence provided on reasonability and plausibility of the estimated costs;
- sometimes the methodology used is not sufficiently well explained and the link between the justification and the cost itself is not fully clear;
- in some cases, the methodologies and assumptions are less robust;
- some projects are not sufficiently substantiated with cost of comparable projects, or the evidence cited could not be accessed;
- funding criteria and beneficiaries are sufficiently detailed;
- there is significant potential overlap between the Recovery and Resilience Plan and other EU facilities, such as the European Structural Investment Funds (ESIF) and Connecting Europe Facility (CEF), but details are not always clear enough or simply not provided on whether double EU funding will be avoided.
While reading through the detailed assessments of cost justifications, we noticed that for some countries only one of above listed factors are mentioned and it is hard to find any critical wording in the assessment, while for others several of them were mentioned and several sentences expressed criticism. This makes us wonder why all countries obtained the same B rating.
Additionally, Belgium obtained a B rating for coherence, because:
- the plan could have better exploited the whole potential of some investments through more far-reaching complementary reforms;
- the plan could have provided greater incentives to trigger private renovations in particular with a strong commitment to reform energy taxes on heating fuels with a view to sending the right price signals;
- there is room to improve the coherence of measures in the sustainability and productivity axes;
- many reforms and investments are not applied uniformly and consistently across the country, which would be warranted.
This page provides a number of Bruegel datasets for public use. Users can freely use our data in its unchanged form or after any transformation for any purpose and can freely distribute it, provided that proper attribution is made to the source, but not in any way that suggests that Bruegel endorses the user or their use of the data.
This dataset will be regularly updated and augmented. Comments to improve the coverage and the estimates are welcome. Please send your comments to [email protected]
About the authors
Related content
The EU recovery fund - state of play and outlook
Live from the Annual Meetings: Bruegel Director Guntram Wolff discusses the EU recovery fund, its state of play and outlook with Nadia Calviño, First

Setting Europe’s economic recovery in motion: a first look at national plans
Plans for spending European Union recovery funds submitted by the four largest EU countries reflect rather different priorities. So far, only Italy is

The impact on the European Union of Ukraine’s potential future accession
This report evaluates the impact on the EU of a possible EU accession of Ukraine, focusing on economic consequences and institutional developments.

The EU needs a methodology for including reform impacts in fiscal trajectories
Such a methodology, and a governance mechanism for managing associated risks, must be in place before the new fiscal framework kickstarts in September