Mind the gap (and its revision)!
In this post Zsolt Darvas presents an analysis of the revisions made to output gap estimates between 2001 and 2015 by the European Commission and the
In a 2013 post I described the uncertainties in estimating structural budget balances (which should reflect the underlying budget position of the government) and argued that a major source of uncertainty is related to the estimation of output gaps. The output gap shows the difference between actual output and potential output, where the latter should represent the output that could be produced if all resources were employed at their long-term sustainable rate.
In this post I present an analysis of the revisions made to output gap estimates between 2001 and 2015 by the European Commission and the IMF.
One can think of various ways to measure these revisions. Due to the importance of structural budget balances in real-time policymaking (e.g. the fiscal adjustment needed in 2015 is based on the structural balance estimate for 2014 and is assessed by considering the expected structural balance in 2015), I focus on the previous year and current year output gap estimates and their revisions a year later.
The following example helps to illustrate the three revision indicators I consider:
Table 1: An example: European Commission May 2012 and May 2013 estimates for the German output gap in 2011-12 (% of potential GDP)
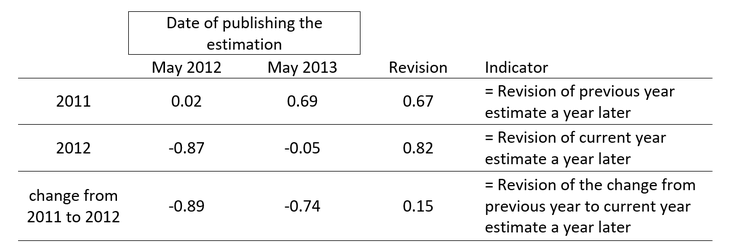
In May 2012, the Commission estimated that Germany was 0.02% above its potential output level in 2011. A year later in May 2013 the estimate for the 2011 output gap was revised to 0.69% of potential GDP. The difference between the May 2013 and the May 2012 estimates for 2011 is therefore 0.67% of potential GDP, and this is what I call “revision of previous year output gap a year later”. My indicator “revision of the current year output gap a year later” is the difference between the May 2013 and the May 2012 estimates for 2012, which is 0.82% of potential GDP. In the example above, both the previous year (2011) and the current year (2012) output gap was revised upwards in the 2013 estimate, so the revision in the change in the output gap from 2011 to 2012 is smaller, 0.15% of potential GDP.
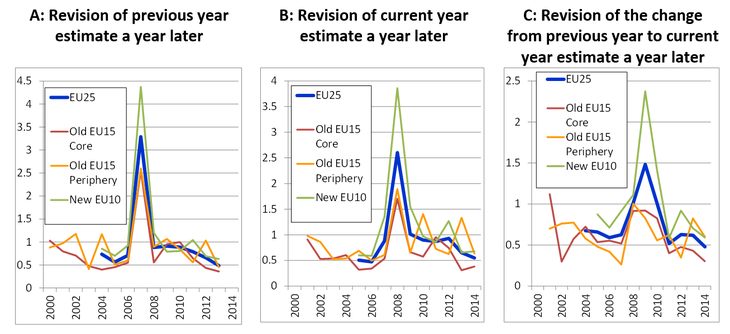
Figure 1 shows the revisions of EC estimates. Since revisions can be both positive and negative, I calculate the absolute value of revisions for each country and then calculate country-averages for each year.
Clearly, the estimates made by the Commission in May 2008 for 2007 (Panel A) and 2008 (Panel B) were hugely revised by May 2009, and there were also major revisions in the forecast change in the output gap around this year (Panel C). However, leaving aside the extraordinary years around 2008, there were still major revisions in both earlier and later years, even for core EU countries. All three revision indicators are typically around 0.5-1.0% of potential output, which is quite large in my view.
Source: author’s calculation using the 2001-2015 editions of the Spring economic forecast of the European Commission.
Note: unweighted country averages of the absolute value of revisions (as % of potential GDP) are reported. Old EU15 Core: Austria, Belgium, Denmark, France, Finland, Germany, Luxembourg, Netherlands, Sweden and the United Kingdom; Old EU15 Periphery: Greece, Ireland, Italy, Portugal and Spain; New EU10: Cyprus, Czech Republic, Estonia, Hungary, Latvia, Lithuania, Malta, Poland, Slovakia and Slovenia. Bulgaria, Romania and Croatia are not included, because EC data is not available for the full period we consider.
Figure 1: Three measures of European Commission output gap estimate revisions (% of potential GDP, absolute value)
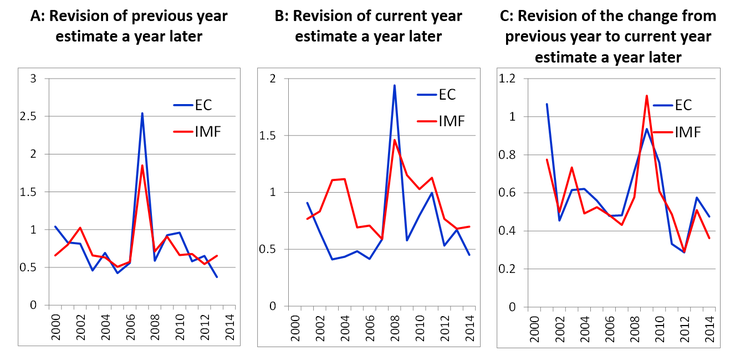
The magnitude of IMF output gap estimate revisions are broadly similar in the case of those twelve EU countries for which both IMF and EC estimates are available for each year in 2001-2015 (Figure 2). Moreover, the revisions in the IMF estimates for non-EU advanced countries (Australia, Canada, Japan, New Zealand, Norway and the United States) were also typically in the 0.5-1.0% range.
Source: author’s calculation using different the editions of the Spring economic forecast of the European Commission and the April World Economic Outlook of the IMF. Note: the April WEOs are typically published 3 or 4 weeks earlier than the May EC forecasts and therefore have a slight informational disadvantage. Unweighted country averages are shown for twelve countries: Austria, Belgium, France, Finland, Germany, Ireland, Italy, Netherlands, Portugal, Spain Sweden and the United Kingdom (among the first 15 EU members, IMF data is not available for the full period for Denmark, Greece and Luxembourg).
Figure 2: Comparison of European Commission and the IMF output gap estimate revisions for 12 EU countries (% of potential GDP, absolute value)
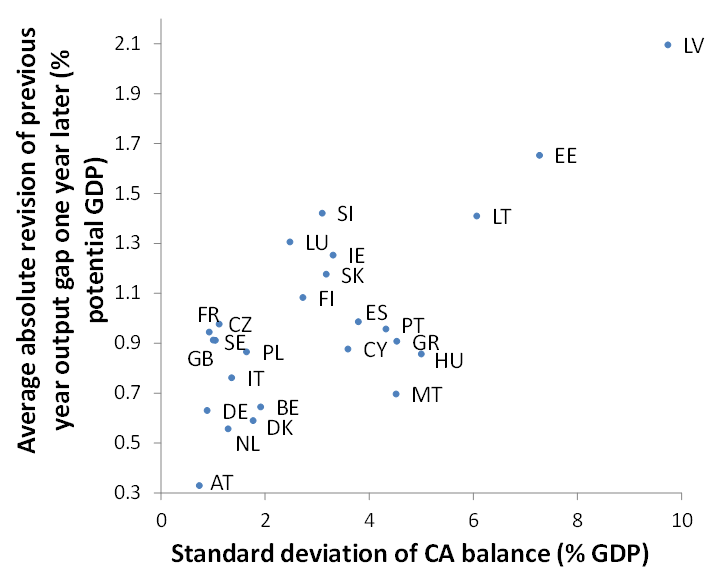
Since I have a new potential output model in the making, which considers information from the current account balance (see the last paragraph of my 2013 post), I also checked if the size of EU/IMF output gap revisions is related to the variability of the current account balance. Figure 3 shows quite a strong association for EC estimates. For example, Austria (denoted by AT on the chart) had the smallest volatility of current account balance in 2004-2013 and the revision of EC output gap estimates was also the smallest in this period. The largest volatility of the current account balance and the largest revision of the EC output gap estimate were observed in Latvia (denoted by LV). The same association between the volatility of current account balance and revision of output gap estimate is also evident concerning IMF output gap estimate revisions.
This finding underlines that the methodologies of the EU and IMF are lacking information, which would be useful in estimating potential output at least for those countries that often have more variable current account balances. (As regards the publication of our model: we have progressed recently and hope to publish a working paper in a few weeks.)
Note: The correlation coefficient is 0.75 for the 25 EU countries considered, the same 0.75 for the sub-group of the 10 newer member states, while it is 0.52 for the EU15 countries (EU members before 2004). The correlation coefficients are similar in the cases of my two other indicators of output gap revision, as well as when considering IMF output gap revisions.
Figure 3: Cross-country correlation between the variability of current account balance and the revisions of the previous year European Commission output gap estimates a year later, 2004-2013
Let me note that these revision measures depend on:
· Methodology: Various statistical methods are used, which essentially assume the smooth continuation of previous trends. When previous trends do not change much (e.g. in the case of Austria), revisions are small. But when previous trends change substantially, revisions became large, as in the case of Latvia. As I showed in my 2013 post, such methods can lead to quite implausible estimates for the NAWRU (non-accelerating wage rate of unemployment), which were revised very substantially when the trend in the unemployment rate changed. TFP (total factor productivity) is smoothed with another statistical method, which is also a source of uncertainty, especially if forecasts for the next few years turn out to be incorrect (see below).
· Forecasts. Forecasts obviously matter in the revision of current year estimates. For example, the estimate for 2015 made in May 2015 depends on the forecasts for 2015. Therefore, revisions of current year estimates may signal that the forecasts for that year were incorrect. This obvious dependence on forecasts is less important for the revision of previous year output gap estimates. For example, in May 2015 most of the 2014 data are available and therefore the forecast component in the 2014 actual GDP data is smaller. However, forecasts also matter due to the methodology. Potential output is calculated for a couple of future years too, and since the methodology uses various data smoothing techniques, longer term forecasts also matter even for the revision of previous year output gap estimates. The use of forecasts partly aims at reducing the end-point uncertainty of the estimates, but if forecasts actually turn out to be highly incorrect, this will have an impact on the estimates for the past too. For example, if the current May 2015 forecasts for 2015-16 and the additional projections for 2017-2024 prove to be wrong, the output gap estimates for 2014 (and to a lesser extent even for earlier years) will be revised too. Unfortunately, large forecast errors were more the rule than the exception in the case of EU countries in recent years.
· Data revisions. GDP data and certain other data, which are used in the EU’s production function methodology, like the stock of physical capital, various demographic variables (which are used to estimate the potential labour input), may be revised from time to time. Such data revisions certainly impact the estimated level of potential output, and may also impact (though likely to a lesser extent) the output gap estimate.
· Changes to the methodology. In this post we report the revisions of EC and IMF output gap estimates made in each consecutive years between 2001 and 2015. During this period, there were certain changes to the methodology. Therefore, the revisions in the output gap estimates reflect changes in the methodology too in those years when there was such a change (note that we compare the estimate made between two consecutive years, so only the changes implemented in between matter). However, these revisions, at least in the case of the EU methodology, impacted only certain technical features, like the 2010 change in the filter used to smooth TFP or the 2014 change in the NAWRU model. None of the methodology reviews changed the basic characteristics of the methodology and small technical changes will likely be implemented in the future too. Thereby, past revisions may be indicative for future revisions. (See the latest description of the EU methodology in Havik et al., 2014).
Certainly, revision of an estimate when new data becomes available is quite natural. Yet there are three reasons to worry about output gap estimate revisions:
1. My finding that size of EC and IMF output gap revisions are correlated with the variability of the current account balance suggests that important information is not utilised in the EC and IMF output gap estimates;
2. The revisions in the previous year and current year estimates one year later in ‘normal’ years are typically around 0.5-1.0% of GDP on average across countries, which is large in my view;
3. Output gap estimates are used for real-time policymaking in Europe, because fiscal adjustment requirements are expressed in terms of the structural budget balance estimate, which is in turn depend on the previous year and current year output gap estimates. Therefore, the imprecision in output gap estimates can translate into fiscal policy recommendations.
In a follow-up blog post I will analyse the revisions in structural balance estimates by the European Commission and the IMF.
About the authors
Related content

The impact on the European Union of Ukraine’s potential future accession
This report evaluates the impact on the EU of a possible EU accession of Ukraine, focusing on economic consequences and institutional developments.

The EU needs a methodology for including reform impacts in fiscal trajectories
Such a methodology, and a governance mechanism for managing associated risks, must be in place before the new fiscal framework kickstarts in September

Emerging countries have replaced most of Russia’s lost trade with advanced economies
Russian trade overall seems to have suffered little from sanctions; meanwhile, medicine and food trade continues with sanctioning countries
