Income inequality boosted Trump vote
Our early econometric analysis shows that Donald Trump performed more strongly in states with higher income inequality. He also did better in states w
Did the level of income inequity influence voters in the 2016 US presidential election? To answer this question, we analysed the currently available results to uncover the factors influencing Trump’s share of the vote.
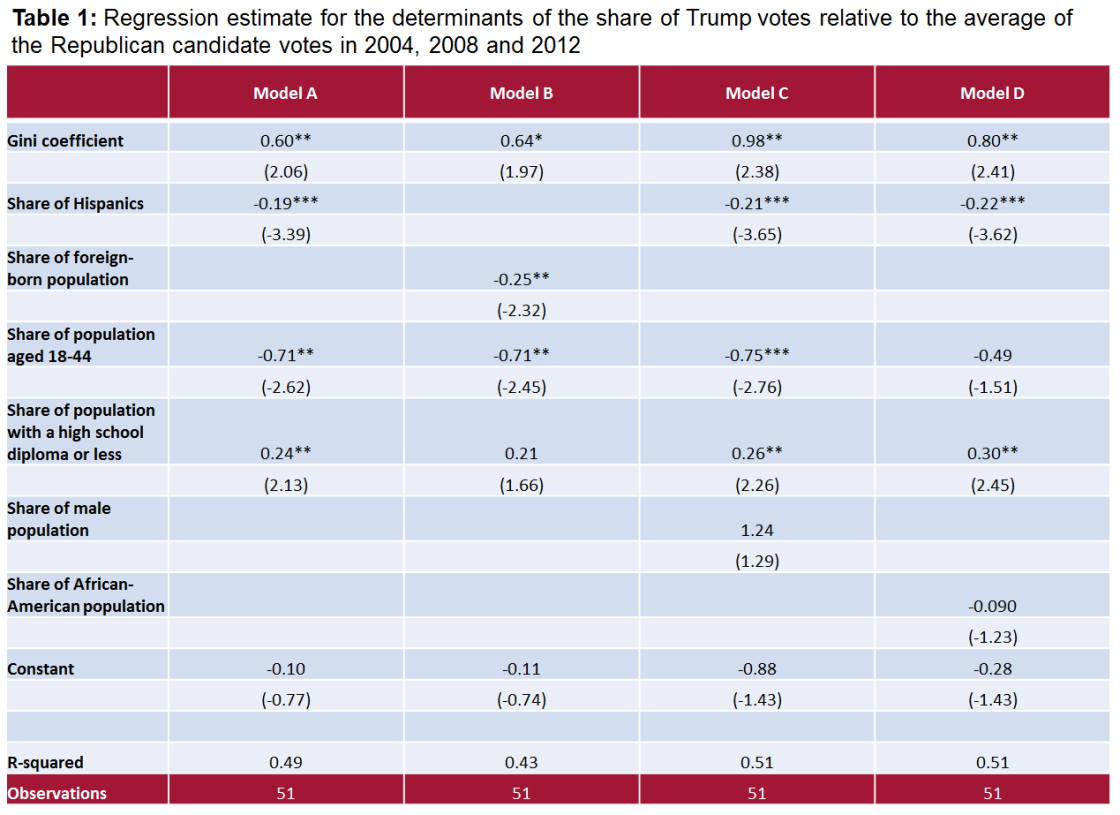
Recent surveys and analyses (for example the Bloomberg report here) show that the share of Trump votes was higher in counties with a higher share of white, middle-income, US-born, rural and less-educated voters. In our econometric regressions we control for some of these factors to see if income inequality has additional explanatory power. Using state-level data, we find that in all variants of our regressions income inequality has a positive and statistically significant parameter estimate (see table below). This means that more unequal states were more likely to vote for Trump.
Since voting behaviour is rather persistent in the US, our dependent variable is the change of the share of Republican candidate votes in 2016 compared to the average in the past three elections, (ie the average of the 2004, 2008 and 2012 elections). Some of the explanatory variables are highly correlated, like the share of Hispanic and the share of foreign born population, so we estimated different versions of the model in which we include only one of the highly correlated variables.
We find that a swing towards the Republicans was stronger in states where:
- Income inequality is higher (measured as the Gini coefficient),
- The Hispanic share of the population is lower,
- The foreign-born share of the population is lower,
- The share of the population that is young (19-44) is lower and the share of older people (45+) is higher,
- The share of the population with at most a high school degree is higher and the share of the population with at least some college education is lower.
On the other hand, when trying to explain the shift to Donald Trump compared with the previous three Republican candidates, our analysis does not find statistically significant effects from gender and the African-American share of the population.
We will refine our calculations by using county-level data later, but these state-level findings already indicate an important role for income inequality in predicting votes for Trump. In fact, our regression results for the determinants of Trump votes are rather similar to the determinants of ‘leave’ votes in the United Kingdom’s June 2016 Brexit referendum, as one of us analysed here. While our results should be interpreted carefully, not least because both main US presidential candidates have certain characteristics which made them unpopular in the eyes of certain segments of the society, our findings are not against the interpretation that the ‘losers’ of globalisation cast protest votes against the status quo.

Notes: The dependent variable is the difference between the share of votes for Donald Trump minus the average share of votes for the Republican candidate in the 2004, 2008 and 2012 elections. t statistics in parentheses, statistical significance: * p<0.10, ** p<0.05, *** p<0.01. Data collected at 11.00CET on 9/11/2016.


