How large is the proposed decline in EU agricultural and cohesion spending?
Cohesion spending is proposed by the Commission to increase by 6% in the next MFF, but inflation is expected to reduce the real value of such spending

In this post we focus on a special aspect of the new proposal from the European Commission for the 2021-2027 EU Multiannual Financial Framework (MFF): by how much have proposed spending commitments on agriculture and cohesion policies changed, compared to the current 2014-2020 MFF?
While the European Commission’s main communication and the various accompanying factsheets clearly compare the current and the next MFF for many spending items – like research, investments, digital transformation, migration and border management, security, defence, and neighbourhood and the world – no document presents a comparison of current and future spending on agriculture and cohesion spending. This is more than surprising, given that these two areas together account for 60% of the proposed EU spending in 2021-2027, and one of the key principles of the proposal is transparency.
Such lack of clarity on the actual changes to the EU’s agricultural and cohesion spending could potentially lead to confusion, partly because there are at least three different ways to measure the changes in spending between the current and the next MFF:
- euro values (“current prices”),
- inflation-adjusted euro values (“constant prices” or “real terms”),
- share in total EU budget spending.
We therefore clarify these numbers in this post.
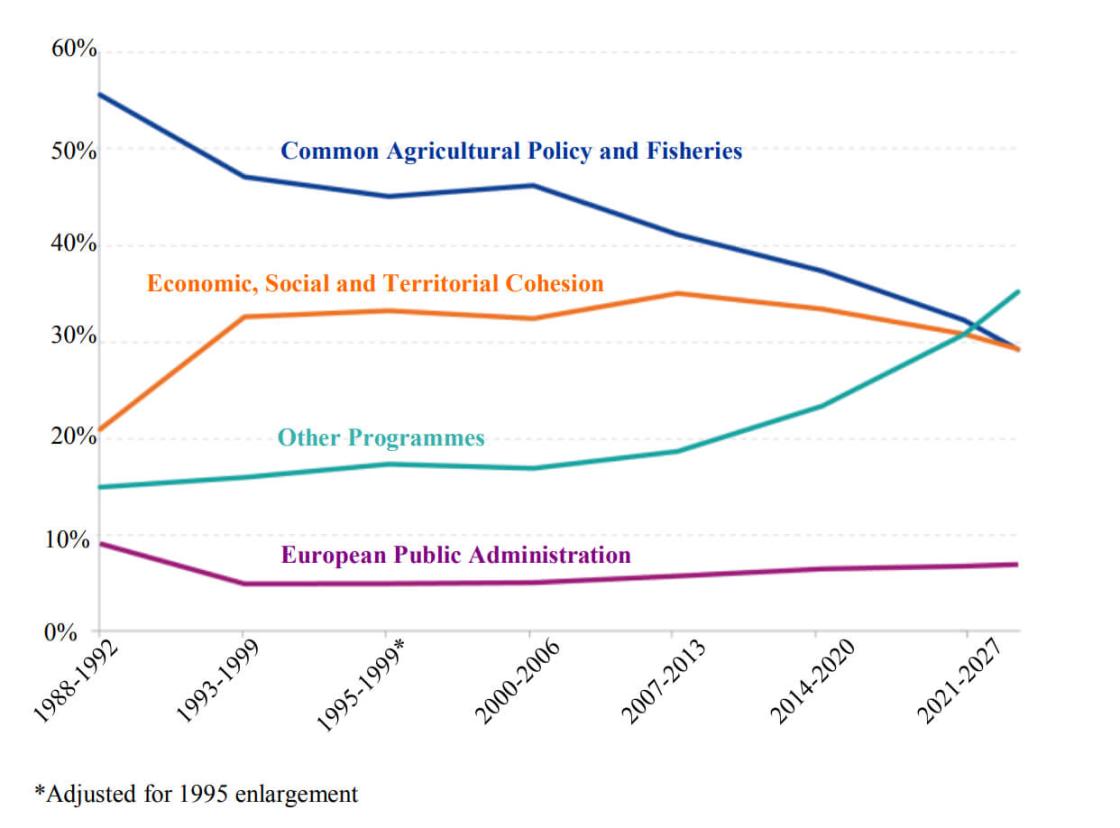
The shares of agriculture and cohesion in the total EU budget spending clearly goes down according to the MFF proposal, as an interesting chart of the Commission report shows (see page 23 here or page 2 here):
Figure 1: Evolution of main policy areas in the EU budget

Source: the chart on page 23 of the 2 May 2018 European Commission communication.
However, the story merits more detail. Since total spending increases a lot from 2014-20 to 2021-27, the reduction in the share of EU spending might not necessarily mean a reduction in the euro value of spending. Total planned commitments in the current 2014-2020 MFF total €1,087 billion, of which about €61 billion could be planned to be committed to UK spending, leaving €1,026 billion for the remaining 27 EU Member States. The proposed commitment ceiling of the 2021-2027 MFF is €1,279 billion, which amounts to an increase of 25%. This increase is close to the 28% gross national income (GNI) increase of the EU27 from 2014-20 to 2021-27 that we projected in our March Policy Brief on the next MFF. By multiplying, for example, the share of cohesion spending in total EU spending by the euro values of total EU spending, we see that cohesion spending in terms of current-price euros is in fact increased.
In order to properly calculate the change in euro values (at both current and constant prices), we focus on the most important individual funds: for the Common Agricultural Policy (CAP) the pillar 1 European Agricultural Guarantee Fund (EAGF – which mostly proves direct transfers to farmers) and the pillar 2 European Agricultural Fund for Regional Development (EAFRD), while for cohesion the European Regional Development Fund (ERDF), the European Social Fund (ESF) and the Cohesion Fund (CF). Since four smaller funds, which are separate funds in the current MFF, are proposed to be merged into the European Social Fund for the period 2021-27, we add these four funds to the ESF for the 2014-2020 period in our calculations.
We also separate out the planned commitments on spending in the UK from the 2014-20 period, because the next MFF is for the 27 remaining members only.
A complicating factor is the inflation rate used to calculate the constant price value of EU spending. In the MFF regulations, a fixed 2%-per-year inflation is used to convert current and constant price numbers from one to the other, irrespective of actual inflation. However, inflation in the past years was well below 2%, implying that the actual increase in the real value of EU spending was larger than what was foreseen in 2013, when the current MFF was adopted. For a correct economic comparison of constant price values, actual inflation has to be used. Therefore, in our calculations we use actual inflation, measured as the GDP deflator of the EU27 not including the UK. The May 2018 European Commission forecast includes this indicator up to 2019, while the IMF April 2018 World Economic Outlook presents forecasts up to 2023. We use these forecasts, and assume that the 2023 inflation will prevail in 2024-27, which is essentially 2% – practically identical to the value used in MFF calculations.
The results of our calculations are included in Table 1. Overall, cohesion spending commitments are planned to be increased by 6%, so there is no planned “cut”, in contrast to many reports in the media. However, inflation erodes the real value, leading to a reduction of 7% in real terms (if inflation will be 2% per year, as the MFF calculations assume and the IMF forecasts). The proposed realignment between the three main funds of cohesion policy is also notable. While the Cohesion Fund (CF) is proposed to be reduced by 37%, the European Regional Development Fund (ERDF) is proposed to be increased by 20%.
The CAP is proposed to be cut by 4%, which corresponds to a reduction of 15% in real terms when we consider a 2% inflation rate in the future. Among the two main components of CAP, there is realignment towards the so-called pillar 1, the European Agricultural Guarantee Fund (EAGF – which mostly proves direct transfers to farmers) from the pillar 2 European Agricultural Fund for Regional Development (EAFRD).
The 6% nominal increase and 7% constant price decline of total cohesion spending should be seen in the light of economic convergence of European regions and countries, which reduces the need for such spending. The distribution of two of the three funds, namely the ERDF and ESF, is primarily based on regional GDP per capita: regions with GDP per capita below 75% of EU average are considered as “less developed”, regions between 75% and 90% of EU average are considered as “transition”, while regions with GDP per capita above 90% of EU average are considered as “developed” (all measured at purchasing power standards). The distribution of the third fund, the Cohesion Fund, is available for countries (i.e. not regions) with GNI per capita below 90% of EU average (that’s why, for example, the UK did not benefit from the Cohesion Fund in 2014-2020, while some UK regions benefitted from the other two funds – see Table 1, comparing column 2 and column 1).
Figure 2 shows that the share of EU27 citizens living in the least-developed regions is gradually falling; a temporary increase around 2010 was primarily the result of the major economic downturn of southern European countries, and in particular Greece. If forecasts are right and thereby convergence will continue, the share of EU citizens living in regions with GDP per capita below 75% of the EU27 average will decline from 29% in 2014 to 22% in 2027, increasing the share of transition regions. The share of transition regions is also somewhat increased by the downward movement of developed regions. This is a long-horizon projection, while the actual allocations for 2021-27 will likely be based on pre-2021 data and, depending on the selected year, the share of less-developed regions might not be reduced that much.
The clear implication is that, with continued convergence, the need for cohesion policy is gradually reduced. To get an impression of the reduced need for cohesion funding, in Table 2 we quantify the total allocation of cohesion funds to these three categories of regions as a share of their combined regional GDP (considering only ERDF and ESF, not CF). Less developed regions receive 1.6% of their GDP, while transition regions receive much less – 0.3% of GDP – and more developed regions even less at 0.07% of GDP.
Certainly, allocations reported in Table 2 refer to the current MFF of 2014-2020 and it is up to the negotiations as to how to allocate funding across the three regions in the next MFF. Furthermore, new indicators beyond GDP per capita could be also considered, as the Commission communication (see pages 9-10) suggests: “The relative per capita gross domestic product will remain the predominant criterion for the allocation of funds – as the main objective of Cohesion Policy is and will remain to help Member States and regions lagging economically or structurally behind to catch up with the rest of the EU – while other factors such as unemployment (notably youth unemployment), climate change and the reception/integration of migrants will also be taken into account.”
In this post we clarified the agricultural and cohesion spending numbers of the proposed next MFF. In subsequent related posts, Grégory Claeys will assess the part of the proposal concerning the euro-area budget, and in another post we will offer our overall evaluation of the whole package.


