Growth uncertainty, European Central Bank intervention and the Italian debt
European Central Bank intervention provides a buffer against the uncertainty faced by European Union economies in the face of COVID-19. For the time b

In the face of the challenges posed by the COVID-19 pandemic, the European Central Bank declared on 18 March 2020 that it “will not tolerate any risks to the smooth transmission of its monetary policy”. In this context, it launched a massive €750 billion Pandemic Emergency Purchasing Programme (PEPP) and announced a waiver of the minimum credit quality requirements for purchasing securities issued by the Greek government. On 7 April, the ECB extended the waiver to collateral in Eurosystem credit operations, and on 22 April it went further to ‘grandfather’ “marketable assets used as collateral in Eurosystem credit operations falling below current minimum credit quality requirements”. All euro-area sovereign debt is therefore acceptable for PEPP or as collateral. Haircuts may still apply, but the ECB also decided a 20% reduction in collateral valuation haircuts. The ECB’s intervention is a potent countervailing force to the heightened economic growth uncertainty brought about by the pandemic.
The waiver expires in September 2021, and this creates a potential cliff-edge effect. Past this deadline, commercial banks are not assured that they can use the bonds of low-rated countries as ECB collateral, and investors are not assured that countries can roll over their maturing debts through ECB purchases (see here for the significance of the debt collateral framework). Consequently, vulnerable countries could see their bond yields rise significantly because of the prospect of a downgrading below the ECB quality threshold. The cliff-edge effect is exacerbated by the reversal of the reduction in collateral haircuts. Restoring the haircuts to their higher values would further increase yields as a second-order effect. Vulnerable countries affected by these changes could be pushed into a bad equilibrium, with increasing debt dynamics and potential debt crises.
One country on the edge is Italy. The Italian debt-to-GDP ratio is expected to increase to 170% of GDP by the end of 2020, but with ECB intervention, its debt would revert gradually to pre-COVID-19 levels of about 140% within about a decade. However, if ECB abides by the September 2021 deadline, Italian spreads could shoot up, leading to an increasing debt trajectory and a potential debt crisis. Figure 1 makes the point clearly.
Figure 1: Debt-to-GDP ratio trajectories for Italy with and without ECB intervention
Source: Bruegel using the model of Zenios et al (2020). Notes: Blue lines show the quantiles of debt trajectories with ECB intervention keeping the Italian spreads constant at 130 basis points. The shaded pink area shows the debt trajectories with the cliff-edge effect when market-driven spreads grow exponentially. The % on the right denote the quantiles at the 0.5, 0.25, 0.50, 0.75 and 0.95 levels.
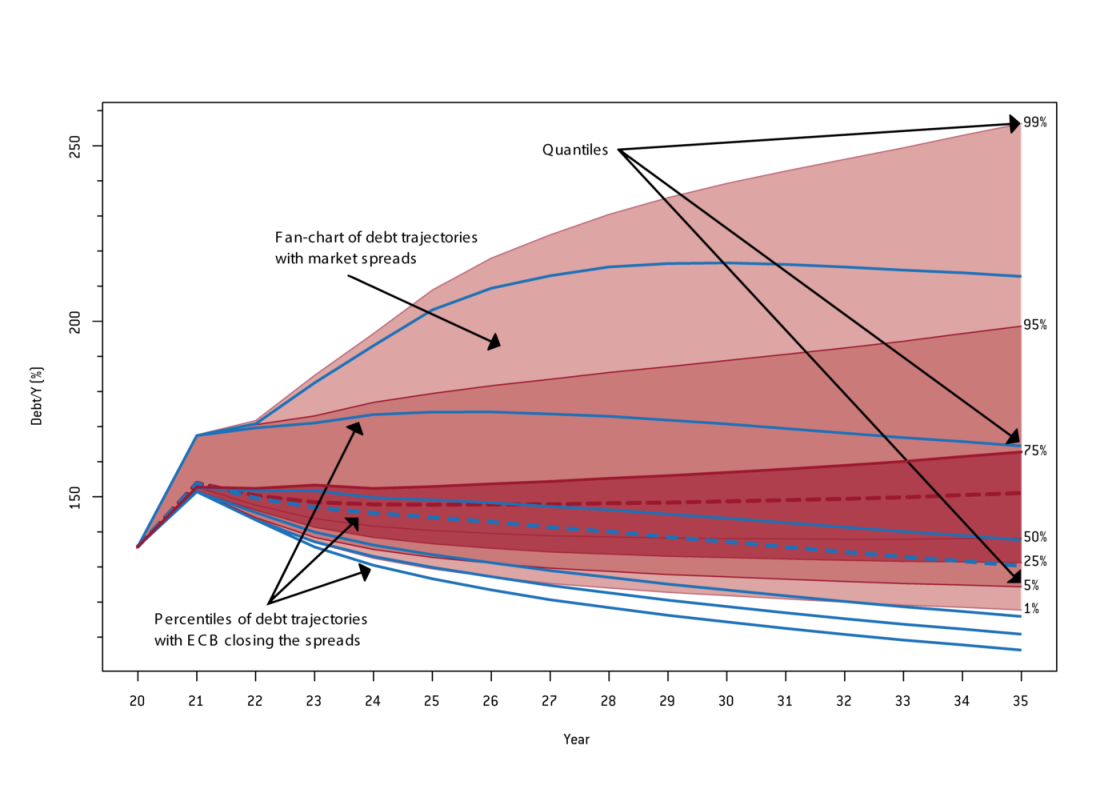
This finding aligns with the concerns expressed by Fitch when Italy was downgraded to BBB- in April 2020 that the country’s debt-to-GDP ratio “will only stabilise at this very high level over the medium term, underlining debt sustainability risks”. In response, the Italian finance minister said that “the strategic orientation of the European Central Bank does not seem to be adequately valued” in Fitch’s downgrading decision, but our analysis shows that it is only with the ECB intervention that the debt is stabilised, albeit at a high level. Otherwise, Italy’s debt will grow, possibly leading to further downgrading and pushing Italy into a debt crisis. Of course, ECB intervention during the euro-area crisis was extensive and many programmes are still active and contribute to keeping sovereign spreads low. It is hard to isolate the effects of the pandemic intervention, but its positive effects seem to be challenged by the September 2021 deadline.
It should be noted that buyers of the 13 October 2020 issue of Italian debt are betting that Italy will be spared the cliff-edge effect, pushing spreads down. This presents Italy with a window of opportunity to focus on growth enhancing policies, taking advantage of the next long-term EU budget and the Next Generation EU recovery instrument.
In the rest of this article we show how we arrived at our estimates. We used scenario analysis to tackle the high uncertainty surrounding growth projections, and integrated the scenarios into a risk optimisation model of sovereign debt financing to obtain the debt dynamics (see here for more information about the risk management optimisation model). We considered specifically a regime in which the refinancing rates for Italy are kept at a constant spread over AAA-rated sovereigns with ECB intervention, and a regime in which ECB intervention is withdrawn and refinancing rates grow at historically observed levels.
Growth uncertainty
An extensive literature links epidemiological and economic models, but reliable GDP forecasts remain elusive. We collected the latest institutional forecasts for Italy from the European Commission, ECB, International Monetary Fund, Organisation for Economic Co-operation and Development, Now-casting Economics and Prometeia (see the appendix), and plotted them using a Box-Whisker diagram (Figure 2). The forecasts diverge widely. There is consensus on a deep recession in 2020 followed by recovery in 2021, with annualised point estimates varying from -14% to -6.5% for 2020, and from 3.3% to 7.7% for 2021, with means being -9.8% and 4.8%, respectively.
How can a policymaker analyse debt dynamics with such widely divergent forecasts of future growth? Should one follow the mean, the median, or the worst case? We turn to these questions next.
Figure 2: Three-year growth projections for Italy
Source: Bruegel based on sources listed in the appendix.

Scenario analysis in the face of unprecedented growth uncertainty
Worst-case analysis is likely to be conservative, and median planning conveys no information about the risks due to forecast uncertainty. Betting on any single point estimate ignores the information contained in all other forecasts. Scenarios facilitate analysis with multiple uncertain parameters that are critical for debt dynamics, possibly correlated, such as interest rates, growth or fiscal stance. Using scenarios, we can obtain the distribution of potential outcomes, and decision-makers can make policy choices with a high level of confidence (eg 95%).
Given an acceptable confidence level, there remains the question of the cost of failure: what is the cost if the economy ends up outside the 0.95 quantile? Tail-risk measures, such as conditional value-at-risk, can be quantified from the scenarios to answer this question.
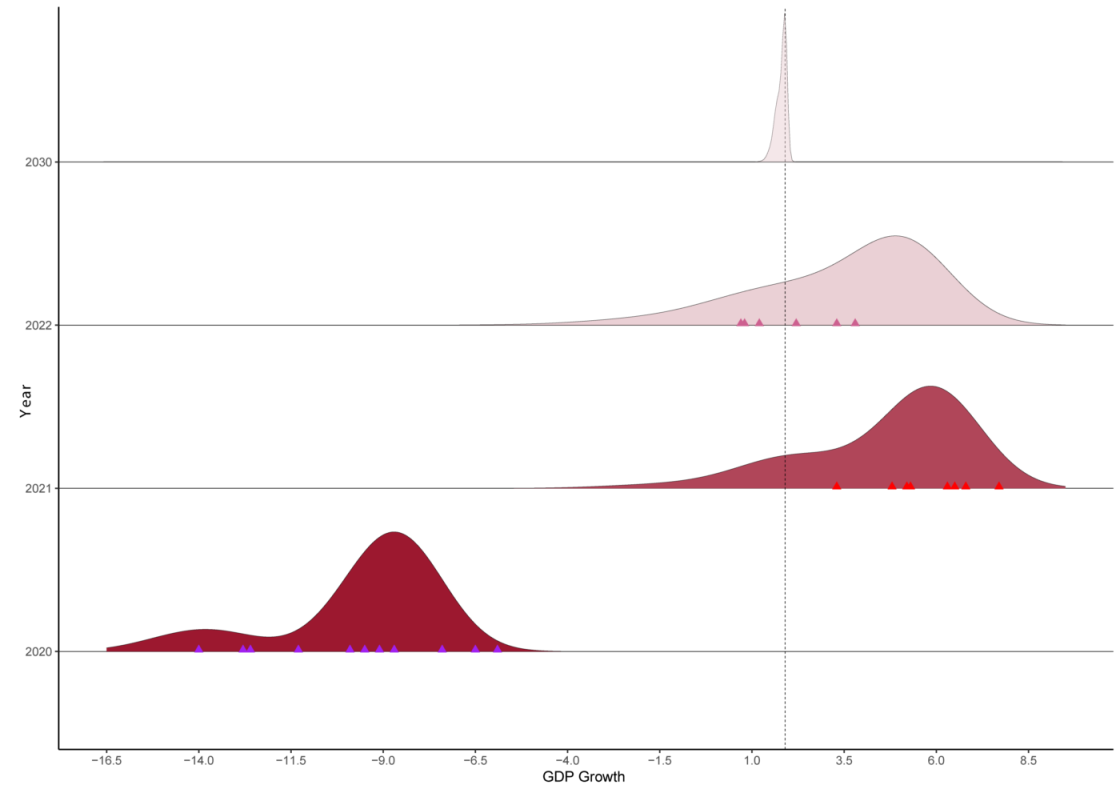
We generated GDP growth scenarios centred on the June 2020 IMF World Economic Outlook projections for Italy for 2020-2021, using historical volatility estimates. The historical volatilities are conservative estimates, and the IMF projections are slightly more optimistic than the mean forecasts. For long-term growth we used the mean estimate of 1.9%, which is higher than the IMF estimate. Overall, we made reasonable assumptions for input data, erring on the optimistic side. In Figure 3 we illustrate the distribution of forecasts, and all the available point estimates, in 2020, 2021, and 2022. The following observations make these distributions intuitively appealing:
- The scenarios cover well the divergent institutional point forecasts.
- The distributions converge on the long-term average with low variability as the pandemic peters out.
Unless policymakers want to bet on a specific projection, such as the IMF’s, they are better informed by considering all plausible scenarios. We used these scenarios to evaluate the debt dynamics for Italy.
Figure 3: The distribution of GDP growth scenarios for Italy at different horizons
Source: Bruegel based on Zenios et al (2020). Notes: The triangles mark point estimate forecasts by the sources listed in the appendix.
Italian sovereign-debt dynamics
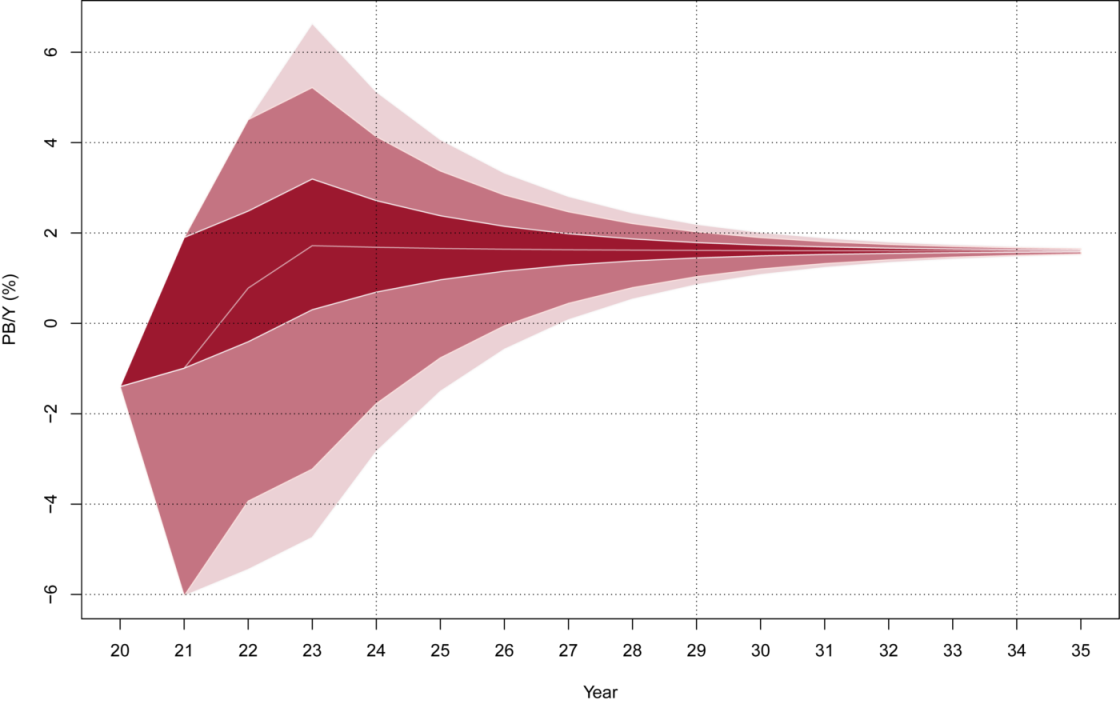
We supplemented the growth scenarios with correlated fiscal scenarios converging on a long-term primary balance of 1.6%, which is the value agreed between the Italian government and the European Commission for Italy’s 2019 budget. We used, again, historical volatility and correlations. Figure 4 (bottom panel) shows the results. In the short run, Italy’s primary balance could decrease up to -6%, which is equivalent to a deficit of about -9.5%. This is in line with Bruegel projections, but somewhat more optimistic than the European Commission’s -11% forecast.
Figure 4: Scenarios for the Italian primary balance and euro-area AAA interest rates
Source: Bruegel, based on Zenios et al (2020), Figure C.1.
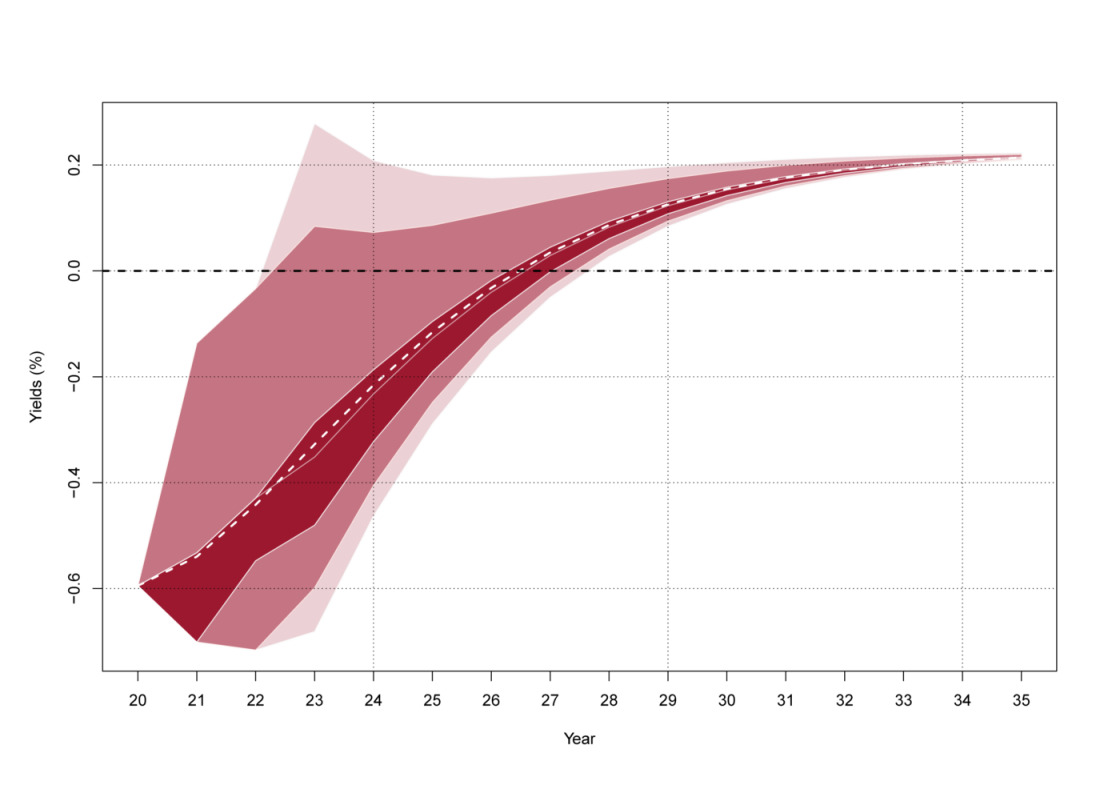
We also illustrate in Figure 4 (top panel) scenarios for 5-year euro-area forward rates that determine the cost of debt refinancing. These scenarios are based on the 5-year forward rates derived from the ECB spot rate curve for AAA-rated bonds from 2020 to 2030. This is the 5-year risk free (i.e. zero spread) rate. We add to this either a constant spread, induced by the ECB intervention, or spreads calibrated to countries’ debt levels.
[1] A spread of 10 basis points is the pre-euro-area crisis estimate, 80bp is the estimate of Zenios et al (2020) based on data during and after the euro-area crisis, and 130bp is the prevailing spread at time of writing for Italy, Greece, and Cyprus.
Fitch’s current rating of Italy is BBB-, a notch above junk, which raises the question of the spreads at which Italy can refinance its debt. Under the current ECB interventions, Italy finances its debt at a constant spread above the AAA rate[1]. On the other hand, in a regime in which Italian debt may not be accepted as collateral, or the collateral haircuts are increased after the cliff edge is passed, spreads would increase with the debt-to-GDP ratio. We used spreads calibrated by ESM staff for 23 euro-area countries from 1995 to 2016, which increase by 3.25 basis points per unit increase of debt-to-GDP ratio past the Stability and Growth Pact threshold of 60%.
We then used our debt sustainability analysis (DSA) model to trace the debt trajectories under the available scenarios and estimated tail risk at different confidence levels. We first performed the DSA under the regime in which Italy refinances its debt at a constant spread, and then switched on the response of spreads to debt ratios.
In Figure 1, we plotted the fan charts of Italy’s debt-to-GDP ratio, with their mean values and selected quantiles. The blue lines were obtained with a constant spread of 130 basis points, which is the spread for Italy at time of writing, reflecting ECB intervention. The pink-shaded fan chart is with spreads growing with debt ratio. With ECB intervention, Italian debt climbs to about 170% of GDP by the end of 2020, in line with the estimates of Zsolt Darvas. What is noteworthy in our analysis is how the trajectories evolve over a ten-year period. With effective ECB intervention, Italian debt declines after 2021 with probability of 95%. On the other hand, the pink-shaded fan chart shows that if Italy has to finance its debt with increasing spreads, the debt trajectory increases with a probability of at least 25%.
Assuming that the current ECB intervention stays in place, the Italian debt would stabilise, reverting within a decade to pre-COVID-19 levels, with a probability of 50%. These dynamics align with the concerns expressed by Fitch that the debt-to-GDP ratio will only stabilise at a very high level over the medium term, underlining debt sustainability risks. If Fitch was concerned about debt sustainability with the debt ratio stabilising at very high level, the prospects of further downgrading with increasing debt are real. A debt increase well above 170% of GDP will almost surely lead to further down-rating if the ECB intervention is not in place after September 2021, and Italy could face a debt crisis.
Growing debt is one of the warning indicators of debt crises used by the IMF and European Stability Mechanism. Increasing debt-to-GDP trajectories that remain above some threshold (taken to be 120% of GDP) can lead to loss of market access and a debt crisis. Debt flow (ie refinancing needs) is another criterion, and values exceeding 20% of GDP for developed economies – or 15% for emerging economies – in general cannot be absorbed by the market. They create rollover risk. Our simulations show a peak of financing needs of 28% in 2021, with a 75% probability. Rollover risk is created exactly when the ECB stops accepting collateral below a quality threshold.
One might argue that ECB intervention during the euro-area crisis altered the spread dynamics, and the calibration we use, which includes the euro-area crisis period, is overly alarming. We note that the spreads for Italy and Greece climbed up to 300 basis points with the onset of the pandemic, so the calibrated response function remains highly plausible. However, we also reverse engineered the spreads that Italy can sustain given its growth and fiscal projections. We estimate, with high probability (75%), that with a spread of 200-250 basis points, the debt dynamics would stabilise. These values are lower than what was observed at the onset of the pandemic and before PEPP was launched. Hence, even with a suppressed response of spreads to debt compared to what we estimate from the 1992-2011 data, Italian debt could be on an increasing path if the PEPP conditions become more stringent after September 2021. On the other hand, Italy issued in October 2020 3-year zero coupon bonds that straddle this deadline. Judging from the demand, investors are betting on unabated ECB asset purchases.
Debt dynamics are also a function of other key variables (long-term growth, fiscal stance). We estimated long-term nominal growth and primary balances that will stabilise Italian debt trajectories in the absence of ECB intervention. We found that a combination of growth of 2.5% and a 1.8% long-term primary balance would stabilise the debt. Italy averaged 2.1% nominal growth over the last twenty years, so it can potentially achieve such long-term combinations of growth and primary balance. However, the ECB-induced low spreads are essential in the short- to medium-term, and a potential reversal after September 2021 poses a real problem.
Conclusion
Scenario analysis can help comprehend the widely divergent forecasts of GDP growth in the context of COVID-19, and allows us to make inferences with high confidence levels about debt trajectories.
We used scenario analysis to evaluate the dynamics of Italian debt and assess the effectiveness of current ECB intervention. In particular, we found that if ECB intervention keeps the spreads constant at about 130 basis points, the Italian debt trajectories are stabilised at a high level, and revert to the pre-COVID-19 level within a decade. If the macro-economic conditions of very low interest rates persist and the ECB stays its current course, Italy can overcome the COVID-19 economic fallout. If the spreads vary without the countervailing force of ECB intervention, then there is a very high probability Italy’s debt trajectory will increase. Italy is vulnerable to growing debt and, as the September 2021 waiver expiration approaches with a prospect of further Italian downgrading, Italian spreads will increase, with possibly significant consequences on debt sustainability. Left alone, Italy could fall over the cliff. But the next long-term EU budget and the Next Generation EU recovery instrument affords the country a window of opportunity to focus on growth enhancing policies.
Note: For the analysis in this blog post, we used the risk management optimisation model for sovereign debt from Zenios, S.A., A. Consiglio, M. Athanasopoulou, E. Moshammer, A. Gavilan and A. Erce (2020) ‘Risk management for sustainable sovereign debt financing’, Operations Research, forthcoming.
We thank Enrique Alberola, Gregory Claeys, Zsolt Darvas, Athanasios Orphanides, Francesco Papadia, Nicolas Veron, Guntram Wolff for comments on an early draft.
Recommended citation:
Consiglio, A. and Zenios, S.A. (2020) ‘Growth uncertainty, European Central Bank intervention and the Italian debt,’ Bruegel Blog, 28 October
data and sources
The table summarises the growth projections for the euro area and Italy by various institutions and private firms. When a given institution makes more than one projection, it means that they provided multiple forecasts, typically contingent on different epidemiological scenarios.
We obtained the data from the following sources:
European Commission from https://ec.europa.eu/info/sites/info/files/economy-finance/annex_2_debt_sustainability.pdf
IMF from https://www.imf.org/en/Publications/WEO/Issues/2020/04/14/weo-april-2020
Now-casting Economics from https://www.now-casting.com/home (subscription required)


