Cleantech manufacturing: where does Europe really stand?
A single European Union cleantech manufacturing capacity target should be based on an understanding of the situation in each cleantech sector

Securing a competitive edge in cleantech manufacturing has increasingly come to be seen as a priority for Europe. China’s dominance of this sector and the subsidies offered under the United States Inflation Reduction Act (IRA) (Kleimann et al, 2023), compelled the European Commission in February 2023 to publish a Green Deal Industrial Plan with the goal of boosting the European cleantech sector and speeding up the transition towards climate neutrality (European Commission, 2023a). The industrial plan’s regulatory pillar is the draft Net Zero Industry Act (NZIA), which includes a target for the European Union by 2030 to have the capacity to manufacture at least 40 percent of its cleantech deployment needs (European Commission, 2023b).
Assessing Europe’s cleantech manufacturing capacity
Meanwhile, basic facts on the status of cleantech manufacturing in Europe are missing from the discussion, which has so far been mainly about global shares of cleantech manufacturing capacity (Figure 1). When looked at from a high-level perspective, China is dominant 1 In assessing China’s cleantech dominance, the capacity and the utilisation rate of its factories must also be taken into account (IEA, 2023). A factory able to produce 1 gigawatt of solar panels but running only 20 percent of the time will produce fewer solar panels than a factory with 250 megawatts of capacity running 90 percent of the time. Levels of utilisation vary greatly across the world, but China generally has much more spare capacity than other countries in the manufacturing of green technologies (IEA, 2023). The average capacity utilisation rate in cleantech manufacturing in the EU is around 80 percent. China’s low capacity utilisation rate drags down the overall global average utilisation rate to about 40 percent of capacity for solar modules and 43 percent for electric vehicle batteries, in which China has about 75 percent of global manufacturing capacity. The capacity utilisation rate is much closer to 80 percent for heat pumps, a market in which Europe and North America combined still have a bigger share of production capacity than China (IEA, 2023). The notion that Europe is trailing behind and heavily reliant on Chinese production to meet its deployment requirements is not entirely accurate, or at least not for all clean technologies. but this perspective does not allow the situation in Europe to be captured fully.
Figure 1 : Regional shares of manufacturing capacity of selected clean technologies, 2021
To address this, we provide an overview of Europe’s current cleantech manufacturing capacity and compare it to current cleantech deployment levels. This assessment is useful for two reasons. First, it allows for a better appreciation of the scale of the EU’s manufacturing capacities. Second, it shows that adopting a one-size-fits-all 40 percent manufacturing target, as proposed under the NZIA, may make little sense considering the very different situations of different clean technologies.
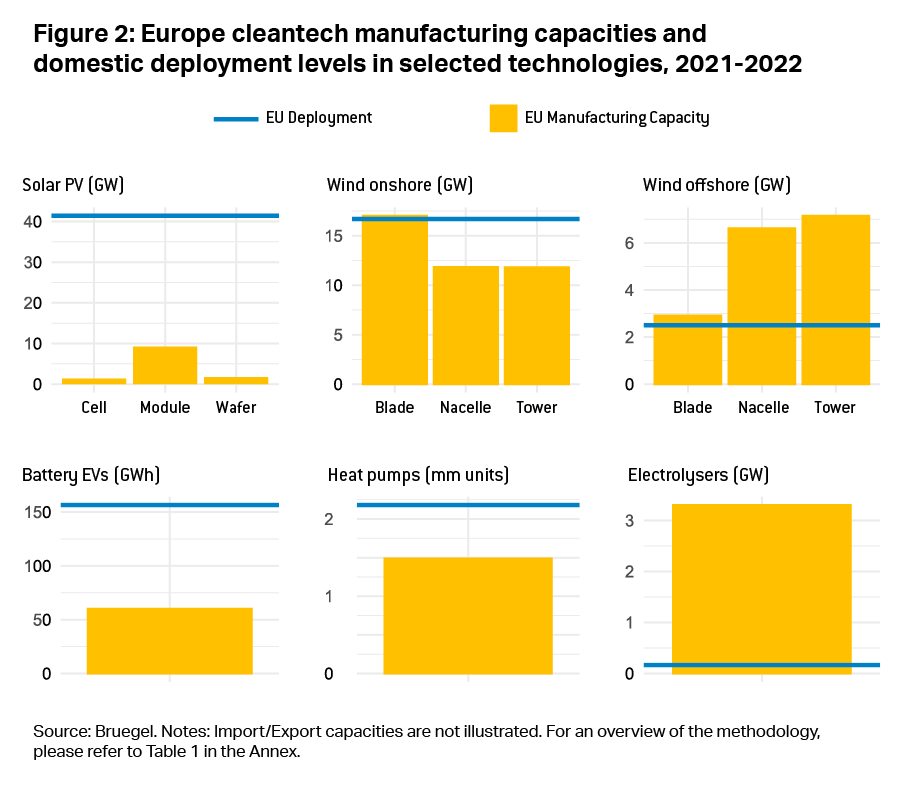
A caveat is here important. A significant share of European cleantech production is currently destined for export and not the EU domestic market. We ignore this trade dimension and compare only domestic cleantech manufacturing capacities to deployment levels, thus taking an approach that is similar to the NZIA and its 40 percent headline target 2 Note that the NZIA 40 percent target refers to EU manufacturing capacity relative to expected deployment in 2030. Here, we compare EU manufacturing to current deployment. . Our analysis covers the manufacturing and deployment levels of five technologies pinpointed by the NZIA: solar photovoltaic (PV) panels, wind turbines (onshore and offshore), electric vehicle batteries, heat pumps and electrolysers (Figure 2).
A variable picture
Figure 2 shows the limited scale of the EU solar PV industry. EU countries installed 41.4 GW of new solar PV capacity in 2022, while EU manufacturers only produced 1.7 GW of wafers, 1.37 GW of cells and 9.22 GW of modules (SolarPower Europe, 2023). In other words, EU solar manufacturers, had all their output been deployed in the EU, would have met only 4 percent, 3 percent and 22 percent of solar deployment needs, respectively.
For wind turbines, however, Europe is well placed. In 2022, EU countries installed 19.2 GW of new wind power capacity in 2022: 16.7 GW onshore and 2.5 GW offshore (Wind Europe, 2023). In 2021, for onshore wind capacity, EU manufacturers produced 17 GW worth of turbine blades, and more than 11 GW of nacelles and towers (Wind Europe, 2023), equivalent to 102 percent and 71 percent of the deployment needs of the following year. For offshore capacity, they produced blades, nacelles, and towers equivalent to 2.9 GW, 6.7 GW and 7 GW respectively (IEA, 2023), or the equivalent of 116 percent and 286 percent of the deployment needs of the following year.
Meanwhile, over 90 percent of clean energy transition-related additions to battery capacity in the EU in 2021 were related to electric vehicles (Bielewski et al, 2022). European electric vehicle sales in 2021 amounted to 2.3 million units, roughly equivalent to a battery capacity of 156 GWh (see Table 1 in the annex for details). But domestic battery manufacturing capacity hovered around 60 GWh, or the equivalent of about 38 percent of the domestic deployment needs (but currently representing only about 7 percent of global manufacturing capacity) (IEA, 2022).
Heat pumps produced in Europe mostly serve the domestic market. In 2021, global heat pump production capacity (excluding air conditioners) was 120 GW. The EU contributed about 19 GW and accounted for 68 percent (Lyons et al, 2022) of Europe’s 2.18 million newly installed heat pumps 3 European Heat Pump Association, ’Heat pump record: 3 million units sold in 2022, contributing to REPowerEU targets’, 20 February 2023, https://www.ehpa.org/press_releases/heat-pump-record-3-million-units-so…. . China supplies most compressors for air-air pumps, while Europe remains the main source for air-water and ground-source pumps.
Finally, water electrolyser manufacturing capacity in Europe stands currently between 2 GW and 3.3 GW per year (Hydrogen Europe, 2022), many times more than the current installed capacity, which is equal to 0.16 GW (European Commission, 2023c). The wide disparity between the current manufacturing capacity and deployment is explained by delays between investment decisions and operational deployment, lack of hydrogen demand compared to supply capacity, and regulatory bottlenecks. It is noteworthy that EU electrolyser manufacturing capacity is still far from the 17.5 GW/year target set for 2030 4 See European Commission press release of 5 May 2022, https://ec.europa.eu/commission/presscorner/detail/en/ip_22_2829. .
Too easy for some, too hard for others
One implication of this analysis is that applying the same 40 percent manufacturing target to each cleantech sector as set out in the NZIA proposal, may make little sense considering the very different situations of different clean technologies. For solar panels, reaching this target would be very challenging and likely very costly, while it would be much easier (and even too conservative) for other technologies, including wind turbines and batteries. It is also unclear to what extent the target would apply to the components and materials used in the identified clean technologies. This is a crucial issue, because access to these components is often a major bottleneck for domestic manufacturing in Europe (Le Mouel and Poitiers, 2023).
Instead of setting cleantech production targets, the EU would better focus on facilitating private sector investment in cleantech by providing the right enabling framework conditions. That is the only course of action that might ultimately secure Europe a competitive edge in cleantech manufacturing.
Bielewski, M., A. Pfrang, S. Bobba, A. Kronberga, A. Georgakaki, S. Letout ... M. Grabowska (2022) Batteries for energy storage in the European Union, - 2022 Status Report on Technology Development, Trends, Value Chains and Markets, Clean Energy Technology Observatory, Luxembourg: Publications Office of the European Union, available at https://publications.jrc.ec.europa.eu/repository/handle/JRC130724
European Commission (2023a) ‘A Green Deal Industrial Plan for the Net-Zero Age’, COM(2023) 62 final
European Commission (2023b) ‘Proposal for a regulation strengthening Europe’s net-zero technology products manufacturing ecosystem’, COM(2023) 161, available at https://single-market-economy.ec.europa.eu/publications/net-zero-industry-act_en
European Commission (2023c) ‘Investment needs assessment and funding availabilities to strengthen EU’s Net-Zero technology manufacturing capacity’, SWD(2023) 68 final, available at https://single-market-economy.ec.europa.eu/system/files/2023-03/SWD_2023_68_F1_STAFF_WORKING_PAPER_EN_V4_P1_2629849.PDF
Hydrogen Europe (2022) Clean Energy Monitor, available at https://hydrogeneurope.eu/clean-hydrogen-monitor-2022/
IEA (2021) The Role of Critical Minerals in Clean Energy Transitions, International Energy Agency, available at https://www.iea.org/reports/the-role-of-critical-minerals-in-clean-energy-transitions
IEA (2022) Global Supply Chains of EV Batteries, International Energy Agency, available at https://www.iea.org/reports/global-supply-chains-of-ev-batteries
IEA (2023) Energy Technology Perspectives, International Energy Agency, available at https://www.iea.org/reports/energy-technology-perspectives-2023
Kleimann, D., N. Poitiers, A. Sapir, S. Tagliapietra, N. Véron, R. Veugelers and J. Zettelmeyer (2023) ‘How Europe should answer the US Inflation Reduction Act’, Policy Contribution 04/2023, Bruegel, available at https://www.bruegel.org/policy-brief/how-europe-should-answer-us-inflation-reduction-act
Le Mouel, M. and N. Poitiers (2023) ‘Why Europe’s critical raw materials strategy has to be international’, Analysis, 5 April, Bruegel, available at https://www.bruegel.org/analysis/why-europes-critical-raw-materials-strategy-has-be-international
Lyons, L., A. Georgakaki, A. Kuokkanen, S. Letout, A. Mountraki, E. Ince ... M. Grabowska (2022) Heat Pumps in the European Union, 2022 Status Report on Technology Development, Trends, Value Chains and Markets, Clean Energy Technology Observatory, Luxembourg: Publications Office of the European Union, available at https://publications.jrc.ec.europa.eu/repository/handle/JRC130874
Poitiers, N., A. Sapir, S. Tagliapietra, R. Veugelers and J. Zettelmeyer (2023) ‘The EU Net Zero Industry Act and the risk of reviving past failures’, First glance, 9 March, Bruegel, available at https://www.bruegel.org/first-glance/eu-net-zero-industry-act-and-risk-reviving-past-failures
SolarPowerEurope (2022) European Market Outlook for Solar Power 2022-2026, available at https://www.solarpowereurope.org/insights/market-outlooks/eu-market-outlook-for-solar-power-2022-2026-2#downloadForm
SolarPowerEurope (2023) EU Solar Manufacturing Map, available at https://www.solarpowereurope.org/insights/interactive-data/solar-manufacturing-map
Wind Europe (2023) Wind energy in Europe: 2022 Statistics and the outlook for 2023-2027, available at https://windeurope.org/intelligence-platform/product/wind-energy-in-europe-2022-statistics-and-the-outlook-for-2023-2027/#downloads
Data on European cleantech manufacturing and deployment capacities
Source: Brugel based on SolarPowerEurope, WindEurope, IEA, EHPA, Clean Hydrogen Monitor. Notes: a Deployment capacity of solar PV refers to newly installed capacity of solar PV in EU27. b,c Deployment capacity of wind onshore/offshore refers to newly installed capacity of onshore/offshore wind installations in Europe (EU and United Kingdom). d Deployment capacity refers to the million units of EVs sold in Europe (EU, Norway, Iceland, Switzerland and United Kingdom) according to IEA (2022). e Deployment capacity is computed by multiplying the amount of electric vehicles sold in Europe (EU, Norway, Iceland, Switzerland and United Kingdom) in 2021 and 43 kWh (equivalent to the average capacity of a battery in battery electric vehicles (BEV) and plug-in hybrid electric vehicles (PHEV)). f Manufacturing capacity of heat pumps is equal to 68 percent (equivalent to the share of suppliers located in Europe) of the total units sold in 2021. Units sold include brine-water, air-water, air-air and sanitary hot water systems sold in Europe (Austria, Belgium, Czechia, Denmark, Estonia, Finland, France, Germany, Hungary, Ireland, Italy, Lithuania, Netherlands, Norway, Poland, Portugal, Slovakia, Spain, Sweden, Switzerland, United Kingdom) in 2022. g Manufacturing capacity refers to the capacity of electrolysers in Europe (EU, Norway, Iceland, and United Kingdom).
Download data from figure 2
About the authors
Related content

Green Industrial Policy in Europe: Past, Present, and Prospects

European natural gas imports
This dataset aggregates daily data on European natural gas import flows and storage levels.

A smart industrial policy to fast-charge Europe’s electric vehicles revolution

The Letta report: an assessment of the energy proposals
The report has the potential to substantially impact the European Union's strategic agenda from 2024-29