The European Investment Bank should invest more, not less
The EIB has played to some extent a counter-cyclical stabilising role by increasing its investment in 2009 and in 2013 and by investing more in h
There is a growing recognition among policymakers, not least thanks to the Jackson Hole speech of ECB President Mario Draghi, that Europe faces the problem of demand shortage, in addition to various structural problems which can be resolved only with suitable supply-side reforms. A good way to stimulate more demand is to increase the investment of the European Investment Bank (EIB); see the promotion of this idea in our memo to the new ECFIN Commissioner Pierre Moscovici.
In fact, the EIB has played to some extent a counter-cyclical stabilising role by increasing its investment in 2009 and in 2013 and by investing more in harder-hit countries.
In the height of the crisis, the EIB has increased its investments from € 47.5 billion (0.38 percent of EU GDP) in 2007 to € 78.8 billion (0.67 percent of EU GDP) in 2009 (see Figure). The increased investment, about 0.3 percent of EU GDP, was non-negligible, but modest compared to fiscal stimulus in other advanced countries such as the United States and Japan. Unfortunately, there was a decline in EIB investment in 2010-12, at a time when the cyclical situation of the European economy deteriorated and most EU countries embarked on a significant fiscal consolidation path. Facing a relapsed economic situation, in 2012 EU leaders agreed to provide €10 billion of new capital to the EIB (which leads to much more investment, because the EIB leverages up its capital) and encouraged the EIB to invest more, which is reflected in the increase in EIB investments in 2013 to € 71.7 billion (0.55 percent of EU GDP).
Figure 1: Annual investment by the European Investment Bank (EIB) according to main sectors in 2000-2013 and the targets for 2014-16 (€ billions)
Source: European Investment Bank.
Note: the sectors are ordered according to their share in total investment (largest in bottom, smallest in top).
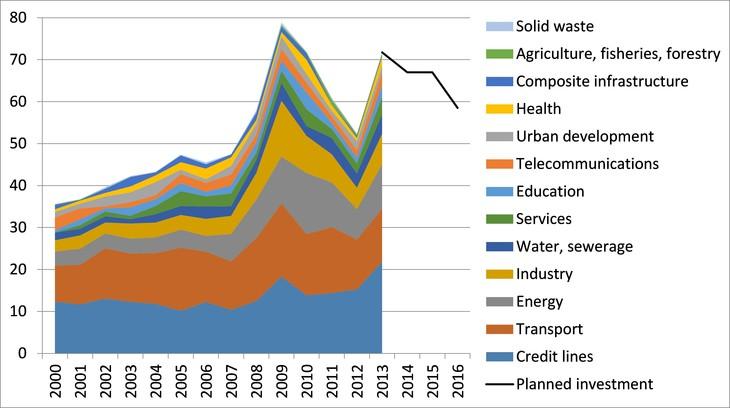
Unfortunately, now when there is a growing recognition that more public investment would be desirable, the EIB plans to reduce investment to €67 billion in 2014 and 2015, while the middle of the targeted range for 2016 is €58.5 billion (see the EIB’s three-year Corporate Operational Plan). Instead of cutting investment, the EIB should significantly increase its investment, which would require a clear call from national leaders of EU countries and further new capital to the EIB beyond the €10 billion agreed in 2012.The country composition of EIB investments suggests that, quite rightly, the EIB tends to invest more in countries (a) hard-hit by the crisis and (b) which are less developed. See a simple regression analysis supporting this hypothesis at the end of this post.
Annex: regression analysis
In order to assess the possible motives behind the allocation of EIB investments across EU countries, we run a very simple regression using data for 27 EU countries:
EIB investment share – GDP share = alpha*unemployment rate + beta*initial GDP per capita + error
That is, we calculated the share of countries in total EIB investments in EU27 (e.g. Italy’s share was 14.8% in 2009-2013), we calculated the share of countries in EU27 GDP (which was 12.4% for Italy) and regressed their difference (which was 2.4%-point for Italy) on the average unemployment rate during the same period and on the GDP per capita at purchasing power standards a year before (i.e. the 2008 value when analysing investments during 2009-13). We run this very simple linear regression both on a pre-crisis sample (2005-2007) and on the sample during the crisis (2009-2013) using data of 27 EU countries.
The following table shows that both before and during the crisis, initial GDP per capita is somewhat related to EIB investment (as the t-statistics are larger than 1 in absolute terms, though well below 2). The negative estimated parameter suggests that more developed countries tend to receive less EIB investment. Unemployment does not correlate with EIB investments before the crisis, but significantly correlates during the crisis. The positive estimated parameter suggests that harder-hit countries tended to benefit more from EIB investments than countries with lower unemployment rates.
Table 1: Regression results
| 2005-2007 | 2009-2013 | ||
| initial GDP/capita | Parameter | -0.026 | -0.024 |
| t-statistics | -1.36 | -1.14 | |
| Unemployment rate | Parameter | 0.12 | 0.32 |
| t-statistics | 0.47 | 2.33 | |
| R2 | 0.13 | 0.27 |
Note: the dependent variable is the difference between the share of countries in EIB investment and the share of countries in EU GDP. The number of observations is 27 (Luxembourg is not included due to its very large GDP/capita figure, which is the result of the special characteristics of the Luxembourg economy.) The explanatory variables were transformed to have zero means. R2 is the coefficient of determination, which measures the goodness of fit of the regression. There may be an endogeneity issue with the regressions (whereby EIB investment is having an impact on unemployment), but in our view this should be a minor issue.
About the authors
Related content

The impact on the European Union of Ukraine’s potential future accession
This report evaluates the impact on the EU of a possible EU accession of Ukraine, focusing on economic consequences and institutional developments.

The EU needs a methodology for including reform impacts in fiscal trajectories
Such a methodology, and a governance mechanism for managing associated risks, must be in place before the new fiscal framework kickstarts in September

Real effective exchange rates for 178 countries: a new database

Emerging countries have replaced most of Russia’s lost trade with advanced economies
Russian trade overall seems to have suffered little from sanctions; meanwhile, medicine and food trade continues with sanctioning countries