Chart of the Week: The Big Mac (index) and euro area adjustment
Following up on previous blog-posts on the Big Mac index and euro area adjustment, the latest data-update suggests a slow-down in the price adjus
Following up on previous comments on the Big Mac index and euro area adjustment, the latest data-update suggests a slow-down in the price adjustment between euro area countries taking place since the beginning of the crisis.
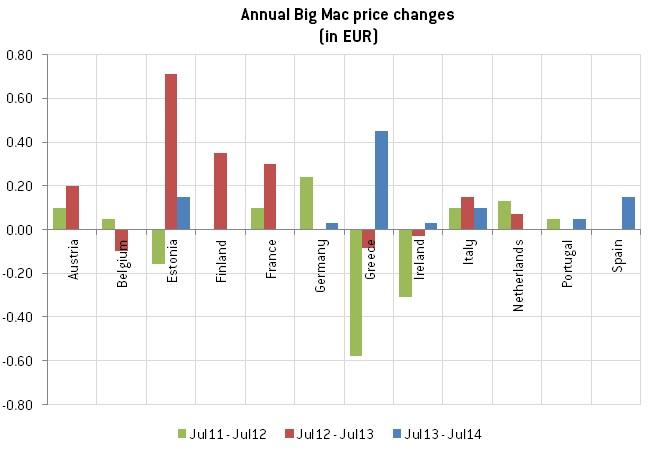
Source: The Economist. Note: the price for Portugal in July 2012 are considered an outlier, interpolation has been used to correct for this.
The chart above shows that there was nearly no change in big mac prices over the last year (blue bar, July 2013 to July 2014), except for Greece. While one could still observe major downward price adjustments of big mac burgers in Greece and Ireland in the period from 2011 to 2012, and to a lesser extent from 2012 to 2013, the price adjustment has stopped in Ireland and even reversed in Greece over 2013-2014. In Portugal, Spain and Italy, no downward pressure of prices could be observed, as big mac prices increased somewhat throughout the period.
A similar picture emerges when looking at inflation developments (see below). Inflation in the euro area has been falling since late 2011, and has been below one percent since October 2013. Core-inflation, a measure that excludes volatile energy and unprocessed food price developments, has followed suit. In particular, since the beginning of 2011, the core-inflation rates of Ireland and Portugal have dipped into negative territory at some point. More interestingly, Greece and to a lesser extent Cyprus have both experienced extended periods of deflation, and in the last months also Spain’s’ core inflation dropped to -0.1 % yoy. However, Greece recently experienced somewhat less deflation (-1.4 % yoy in June 2014) than some months ago and also Cypriot and Irish core inflation rates are on an upward trend. This suggests that price adjustment has slowed down in these countries.
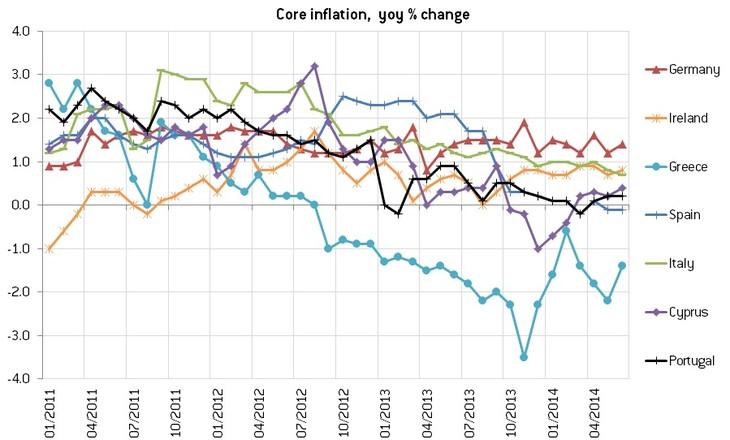
Source: Eurostat
About the authors
Related content

How to provide liquidity to banks after resolution in Europe’s banking union
Banks deemed to be failing or likely to fail in the banking union are either put into insolvency/liquidation or enter a resolution scheme to protect t

An update: sovereign bond holdings in the euro area – the impact of quantitative easing
Since the European Central Bank’s announcement in January 2015 of its quantitative easing programme, national central banks have been buying governmen

Analysis of development in EU capital flows in the global context
The monitoring and analysis of capital movements is essential for policymakers, given that capital flows can have welfare implications. This report, c

Returns on foreign assets and liabilities: exorbitant privileges and stabilising adjustments
Large stock of foreign assets and liabilities could foster international risk diversification. US, British and Japanese investors earn high yields on