European Emission trading - A blueprint for a countercyclical policy without teeth
Carbon emissions have been falling, but perhaps not for the most sustainable reasons. The graphs below show volumes of carbon emissions produced by th
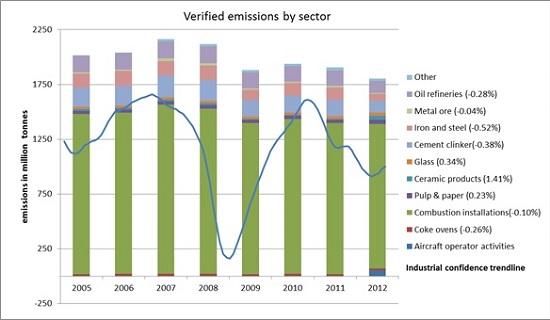
Carbon emissions have been falling, but perhaps not for the most sustainable reasons. The graphs below show volumes of carbon emissions produced by the European industrial sector. Data come from the EU Community Independent Transaction Log (CITL), a compendium of trading activity in carbon emission allowances. Recently released 2012 data continue to show a trend of falling emissions. From a high of 2000 million tonnes of carbon dioxide in 2007, carbon emissions have fallen to just over 1800 million tonnes in 2012. The decline in emissions activity is reflected almost uniformly across regions and across sectors.
This observation is unsurprising. What started as a financial crisis in 2008 has had significant impacts on the real economy. Industry produces less to meet lower demand, and therefore emits less carbon. This story is illustrated by Eurostat’s industrial confidence indicator superimposed on the graph of sectoral emissions.
It is interesting, however, to probe the data a bit further. In addition to verified emissions, CITL provides data on allocated emissions allowances. The difference between verified emissions and allocated emission allowances can be thought of as an allowance surplus. It is basically the difference between the amount of carbon a firm was allowed to pollute and the amount of carbon the firm actually polluted. This difference can be traded at the carbon market.
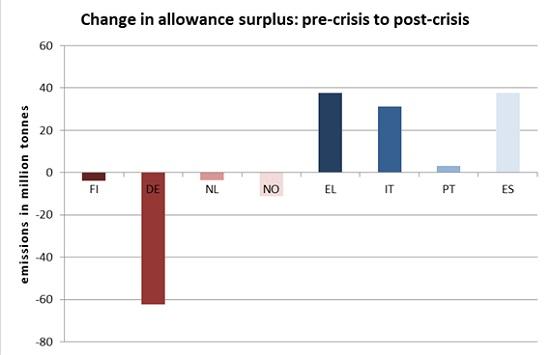
Figure 2 demonstrates an interesting trend in the change in surpluses over the crisis period. Countries that have weathered the crisis relatively well show a decline in the surplus, whereas countries that have struggled demonstrate an increase in the allowance surplus. In particular the surplus in Germany is about 60 million tonnes lower while that in Spain and Italy is about 30-40 million tonnes higher. This indicates a sort of intra-European transfer mechanism. While not an explicit goal of the ETS, this points to a possible countercyclical function of the EU-wide trading mechanism.
As the treasuries in all EU countries are allowed to sell a fixed quota of allowances while industry only uses allowances if it is producing , a tight ETS could be an effective European countercyclical fiscal policy. However, at the current emission allowance price of about €5 per tonne this countercyclical potential is not reaped. The transfer only amounts to about €300 million from Germany to Italy and Spain. At a carbon price of €20 observed before the crisis, this transfer would already amount to more than one billion Euro. The recent Policy Brief proposes one mechanism to get a more sensible ETS price. This could bolster an additional tool in the countercyclical arsenal, at a time when Europe most needs them.
About the authors
Related content

European natural gas imports
This dataset aggregates daily data on European natural gas import flows and storage levels.

The Letta report: an assessment of the energy proposals
The report has the potential to substantially impact the European Union's strategic agenda from 2024-29

The impact on the European Union of Ukraine’s potential future accession
This report evaluates the impact on the EU of a possible EU accession of Ukraine, focusing on economic consequences and institutional developments.

Beyond the numbers of EU national energy and climate plans
The authors conduct a simple relative frequency analysis for a series of words mentioned in the NECPs to identify interesting policy insights within