Where did smart money go in 2012?
The short answer is: into the periphery of Europe.
The short answer is: into the periphery of Europe.
The longer answer starts from the chart below, showing the return on two portfolios of government securities since the beginning of the crisis: one portfolio invested in the core euro area and another invested in the periphery. The size of the circles, indexed at 100 in December 2006 for both portfolios, changes with the market value of the portfolio at the date indicated in the horizontal axis. The vertical height of the circles indicates the 12 month return in December of the last 6 years.
The main developments are:
- In 2012 the periphery portfolio has greatly outperformed the core portfolio in returns;
- However, the core portfolio has had both a higher average return and a lower volatility than the periphery portfolio over the last 6 years.
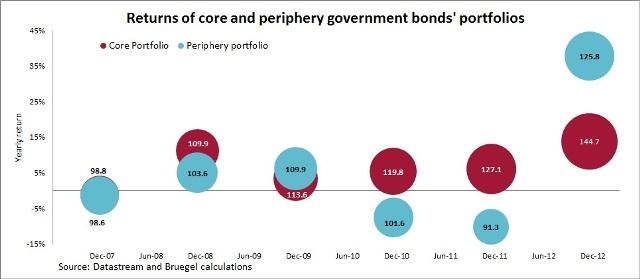
One can read the height of the bubbles as an indicator of the assessment by the market of the euro area periphery: close to desperate at the end of 2010 and 2011, improving drastically since, with a strengthened enthusiasm since the summer of this year.
One is tempted to link the improved assessment by the market to the progress in dealing with the crisis:
- The on-going correction of macroeconomic imbalances (current accounts, budgetary deficits, competitiveness indices, see Chart of the week - Economic convergence in the euro area);
- The institutional innovations achieved (ESM, Fiscal Compact) or being pursued (Banking Union) to complement Monetary Union;
- The announcement by the European Central Bank of the Outright Monetary Transactions program.
In this positive interpretation, the market is gradually switching back from a “bad” to a “good” equilibrium, recognizing that its assessment was too negative and that the euro area is doing, admittedly with its unexciting style and timing, what is needed to gradually get out of the crisis with a stronger monetary union than the one that came out from Maastricht.
During the course of 2012, the big losses which were reported for the investors which bet on a progressive deterioration of the euro area crisis and the big gains achieved by those who maintained a more positive assessment are likely to reinforce the effects of recent developments on market sentiment.
However, the return of interest of investors for the periphery does neither show, that the crisis is over or even that a linear trend out of the crisis has been established. The risk of reversals is strong, in particular under the form of adjustment fatigue in the periphery and support fatigue in the core. The Banking Union is far from being achieved (see: Europe's single supervisory mechanism and the long journey towards banking union). Macroeconomic conditions, with the ECB now forecasting positive growth for the euro area only for 2014 (measured on a yearly basis) and the periphery in the grip of serious recession, create a strong headwind for all efforts to come out of the crisis.
It is hard to deny, however, that the behaviour of the market is consistent with the assessment that substantial progress has been made with respect to the trough of the crisis at the end of last year.
Technical note:
The previous exercise reflects what would have happened if an investor had bought this pair of GDP weighted portfolios of 10 years zero coupon euro area sovereign bonds at the beginning of December of 2006 and had sold it 12 months later (9 years before their maturity date), then using this money (principal plus return) she would have purchased a new pair of 10 years zero coupon portfolios and sold them after 12 months, and had repeated the process every 12 months.
The numbers resulting from this exercise should not be taken as actual returns of these portfolios, as they correspond to zero coupon bonds that do not exist in real markets and their returns are highly dependent on the chosen dates to buy and sell.
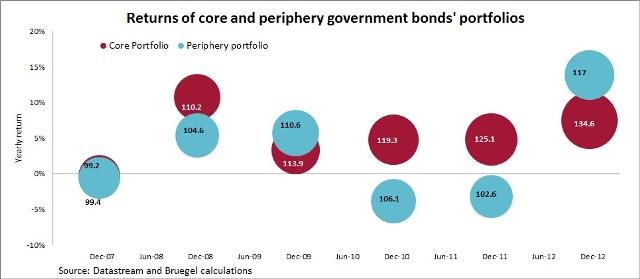
As a way to illustrate this fact, we performed a second exercise with an alternative approach, in which another investor buys exactly the same portfolios of 10 years zero coupon euro area sovereign bonds in the same date of December 2006, but holds the portfolios indefinitely, thus in the next graph the returns are those that she would have obtained if she would have sold the portfolios at the date indicated on the horizontal axis. As it can be observed the numbers change dramatically, but the behaviour of the portfolios and implications are identical.
About the authors
Related content

The European Central Bank’s timid operational framework update
The European Central Bank announced limited changes to its operational framework – which is probably right given current uncertainty

Don’t look only to Brussels to increase the supply of safe assets in the European Union
A sufficient supply of safe assets denominated in euros is critical if the European Union is to achieve a full banking and capital markets union.

Central banks: uncertainty is the problem, not managing the trilemma
Regaining price stability is difficult but doable; the bigger problem facing central banks is economic uncertainty.

The European Central Bank’s latest move tells a clear story
The European Central Bank is right not to over-react to recent banking problems.