Blogs review: GDP revisions, news and noise
What’s at stake: The numbers guiding policymakers and experts are subject to revisions as "advance" estimates are based on incomplete source
What’s at stake: The numbers guiding policymakers and experts are subject to revisions as "advance" estimates are based on incomplete source data. Until recently, most economists thought that data revisions were likely to be small and inconsequential. But the size of data revisions over the past few years have made a convincing case that data revisions may be large and have important implications for both policies (as exemplified by role of revisions in the debate about shifts in the Beveridge curve) and the variables we choose to measure output growth (GDP vs. GDI).
The scale of recent revisions
Dylan Matthews writes that it’s worth remembering just how subject to error these early GDP estimates are. According to the BEA, the average revision in either direction is 0.5 points between the first and second estimate, 0.6 between the first and third, and 1.3 between the first and last. That’s a huge amount of error. Here’s how revisions have looked from 2008 to the first quarter of 2012.
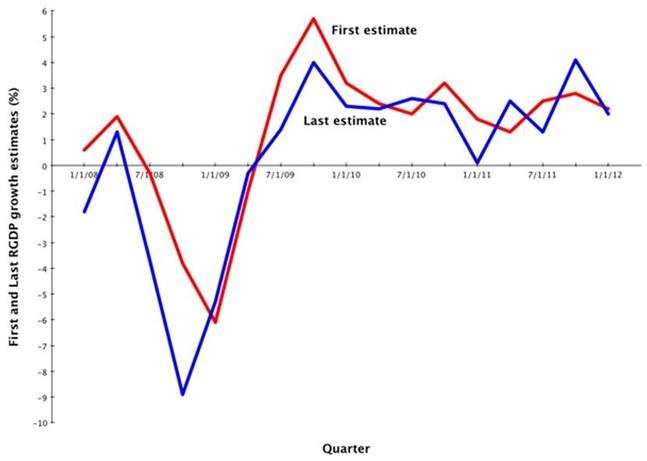
Source: Wonkblog
Brad Plummer quotes Moody’s chief economist Mark Zandi saying that the revisions suggest that the recession following the financial crisis was much, much more severe than we’d thought. Calculated Risk writes that the consensus is that Q3 GDP will be revised up to 2.8% annualized growth, from the advance estimate of 2.0% when the BEA releases its second estimate on Thursday.
The predictability of revisions: normal vs. unusual times
Dean Croushore and Tom Stark writes that research that deals with the fact that data are revised has been ongoing since the 1960s. A substantial body of research has been devoted to examining the efficiency of data production or investigating the nature and statistical properties of data revisions. Data revisions are important because they may affect policy decisions or the manner in which such decisions depend on the most recent data. Revisions may also affect people’s expectations. A number of authors have investigated the role of data revisions in affecting monetary policy rules, how measures of monetary policy shocks are affected by data revisions.
In a 1986 NBER paper, Gregory Mankiw and Matthew Shapiro, for example, documented that the revisions in GNP data were not forecastable, implying that the preliminary estimates are efficient given available information.
In a recent Journal of Economic Literature paper surveying progress at the frontier of real-time data analysis, Dean Croushore notes that there is some difference in the sizes of data revisions depending on the state of the business cycle. This may not be surprising, as we know that a forecast is generally smoother than a data series being forecast and, with missing source data, government statistical agencies are implicitly making forecasts of missing data. Thus, when better data become available later, they would tend to show downward revisions in recessions (for variables measuring economic activity) and upward revisions in expansions.
Data revisions and the debate between GDI and GDP
Jeremy Nalewaik of the Federal Reserve Board argues in a recent Brookings paper that the two official measures of U.S. economic output, gross domestic product (GDP) and gross domestic income (GDI), have shown markedly different business cycle fluctuations over the past 25 years, with GDI showing a more pronounced cycle than GDP. The paper reports a broad range of results that indicate that GDI better reflects the business cycle fluctuations in true output growth. Results on revisions to the estimates, and correlations with numerous other cyclically sensitive variables, are particularly favorable to GDI. The most recent GDI data show the 2007–09 downturn to have been considerably worse than is reflected in GDP.
Cardiff Garcia writes in the FT Alphaville blog that as better data have become available and the Bureau of Economic Analysis (which calculates both) has accordingly revised its earlier estimates, it is GDP that has been adjusted in the direction of GDI rather than the other way round.
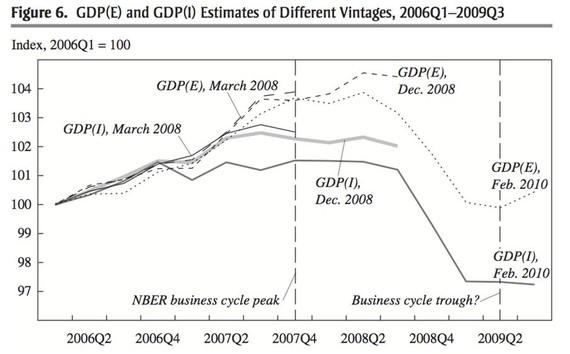
Source: Jeremy Nalewaik
Donald Marron argues that despite this confusion, two clocks are better than one. In an interview, Jeremy Nalewaik points out that the Business Cycle Dating Committee of the National Bureau of Economic Research now uses GDI as well as GDP and other monthly indicators in determining the official dates of business cycle peaks and troughs. They use GDP and GDI judgmentally, and also as a 50-50 weighted average, similar to the proposal Nalewaik put forth in the Brookings paper for using such a 50-50 average as the official measure of U.S. economic output. There is ample precedent for that as illustrated by Australia, which has featured an average of different output measures since 1991.
Dean Baker has a different story for explaining the observed difference between GDP and GDI based on the way capital gains are recorded. If that story is true we are better off sticking with our old friend GDP as the best measure of economic growth.
Data revisions and the debate about the Beveridge curve
Mike Konczal writes that the debate over structural unemployment that has taken place surrounding high levels of job openings and the Beveridge curve in 2010 needs to be reconsidered based on data revisions. A large debate broke out among economists, with one side saying that the rise in job openings showed deeper problems in the American workforce and another side saying that the rise in job openings was a natural part of a cyclical downturn and that we’d see circular motions in the Beveridge curve. Conferences were held, panels convened; Peter Diamond spent part of his Nobel Laureate lecture discussing these issues. Both sides took for granted that the 2010 job opening rates had increased to the extent that the BLS reported they had.
Mike Konczal, however, notes that since April 2010 when concerns about structural unemployment started to enter the debate, the Beveridge curve has almost entirely shifted leftward. Due to a pre-recession calibration of its birth/death model, the Bureau of Labor Statistics dramatically overestimated the number of job openings throughout 2010. It corrected the numbers for 2009 through 2010 in March 2011.
Databases on data revisions
Dean Croushore writes that following the success of the Real-Time Dataset for Macroeconomists, other real-time databases have been developed all over the world. In the United States, the Federal Reserve Bank of St. Louis developed the ALFRED database, keeping successive vintages of the FRED database and making the data available in a convenient form. The Bureau of Economic Analysis has also kept all the vintages of their Excel files containing National Income and Product Account data available since 2002. The OECD now has a large real-time dataset containing data for all the countries in the OECD, and the Euro Area Business Cycle Network recently made a real-time database available for all the countries in the euro area. The United Kingdom, New Zealand, and Japan also maintain their own real-time databases. The links to these databases are available here.
The EABCN Real Time Database (RTDB) is an dataset that consists of vintages, or snapshots, of time series of several variables, based on series reported in the ECB’s Monthly Bulletin (MoBu). The dataset was constructed by retrieving data stored in so called “frozen” databases which were used to produce MoBu’s statistical tables as made available ahead of publication to the Governing Council members before their first meeting of the month. The technical documentation contains description of each series included in the RTDB. It is divided into main blocks (annual, quarterly, and monthly) and then further into economic concept related blocks.
Data revisions in developing countries
Brad Plummer writes that our bouncy revisions are utterly tame compared with what Africa has to contend with. Take Ghana. As Morten Jerven of Simon Fraser University explains, the country’s GDP estimates turned out to be off by a whopping 60 percent. As a result, Ghana was suddenly upgraded from a low to lower-middle-income country. One big problem is that calculating GDP — the measure of how much value is being added throughout the economy — is extremely tricky in a country with sparse data. So government agencies in places like Ghana or Nigeria typically pick a “base year” in which there’s unusually good data on the economy. The agencies can then layer on the additional data they collect each year to get a rough estimate of growth. But as Jerven explains, there’s a big flaw in this approach. Ghana’s previous base year had been set back in 1993. The structure of the country’s economy had changed radically since then.